Product Tour
Follow a typical research workflow: Find opportunities → Evaluate risk → Understand the trade → Make your decision. See how SmartQuant provides data and analysis at each step.
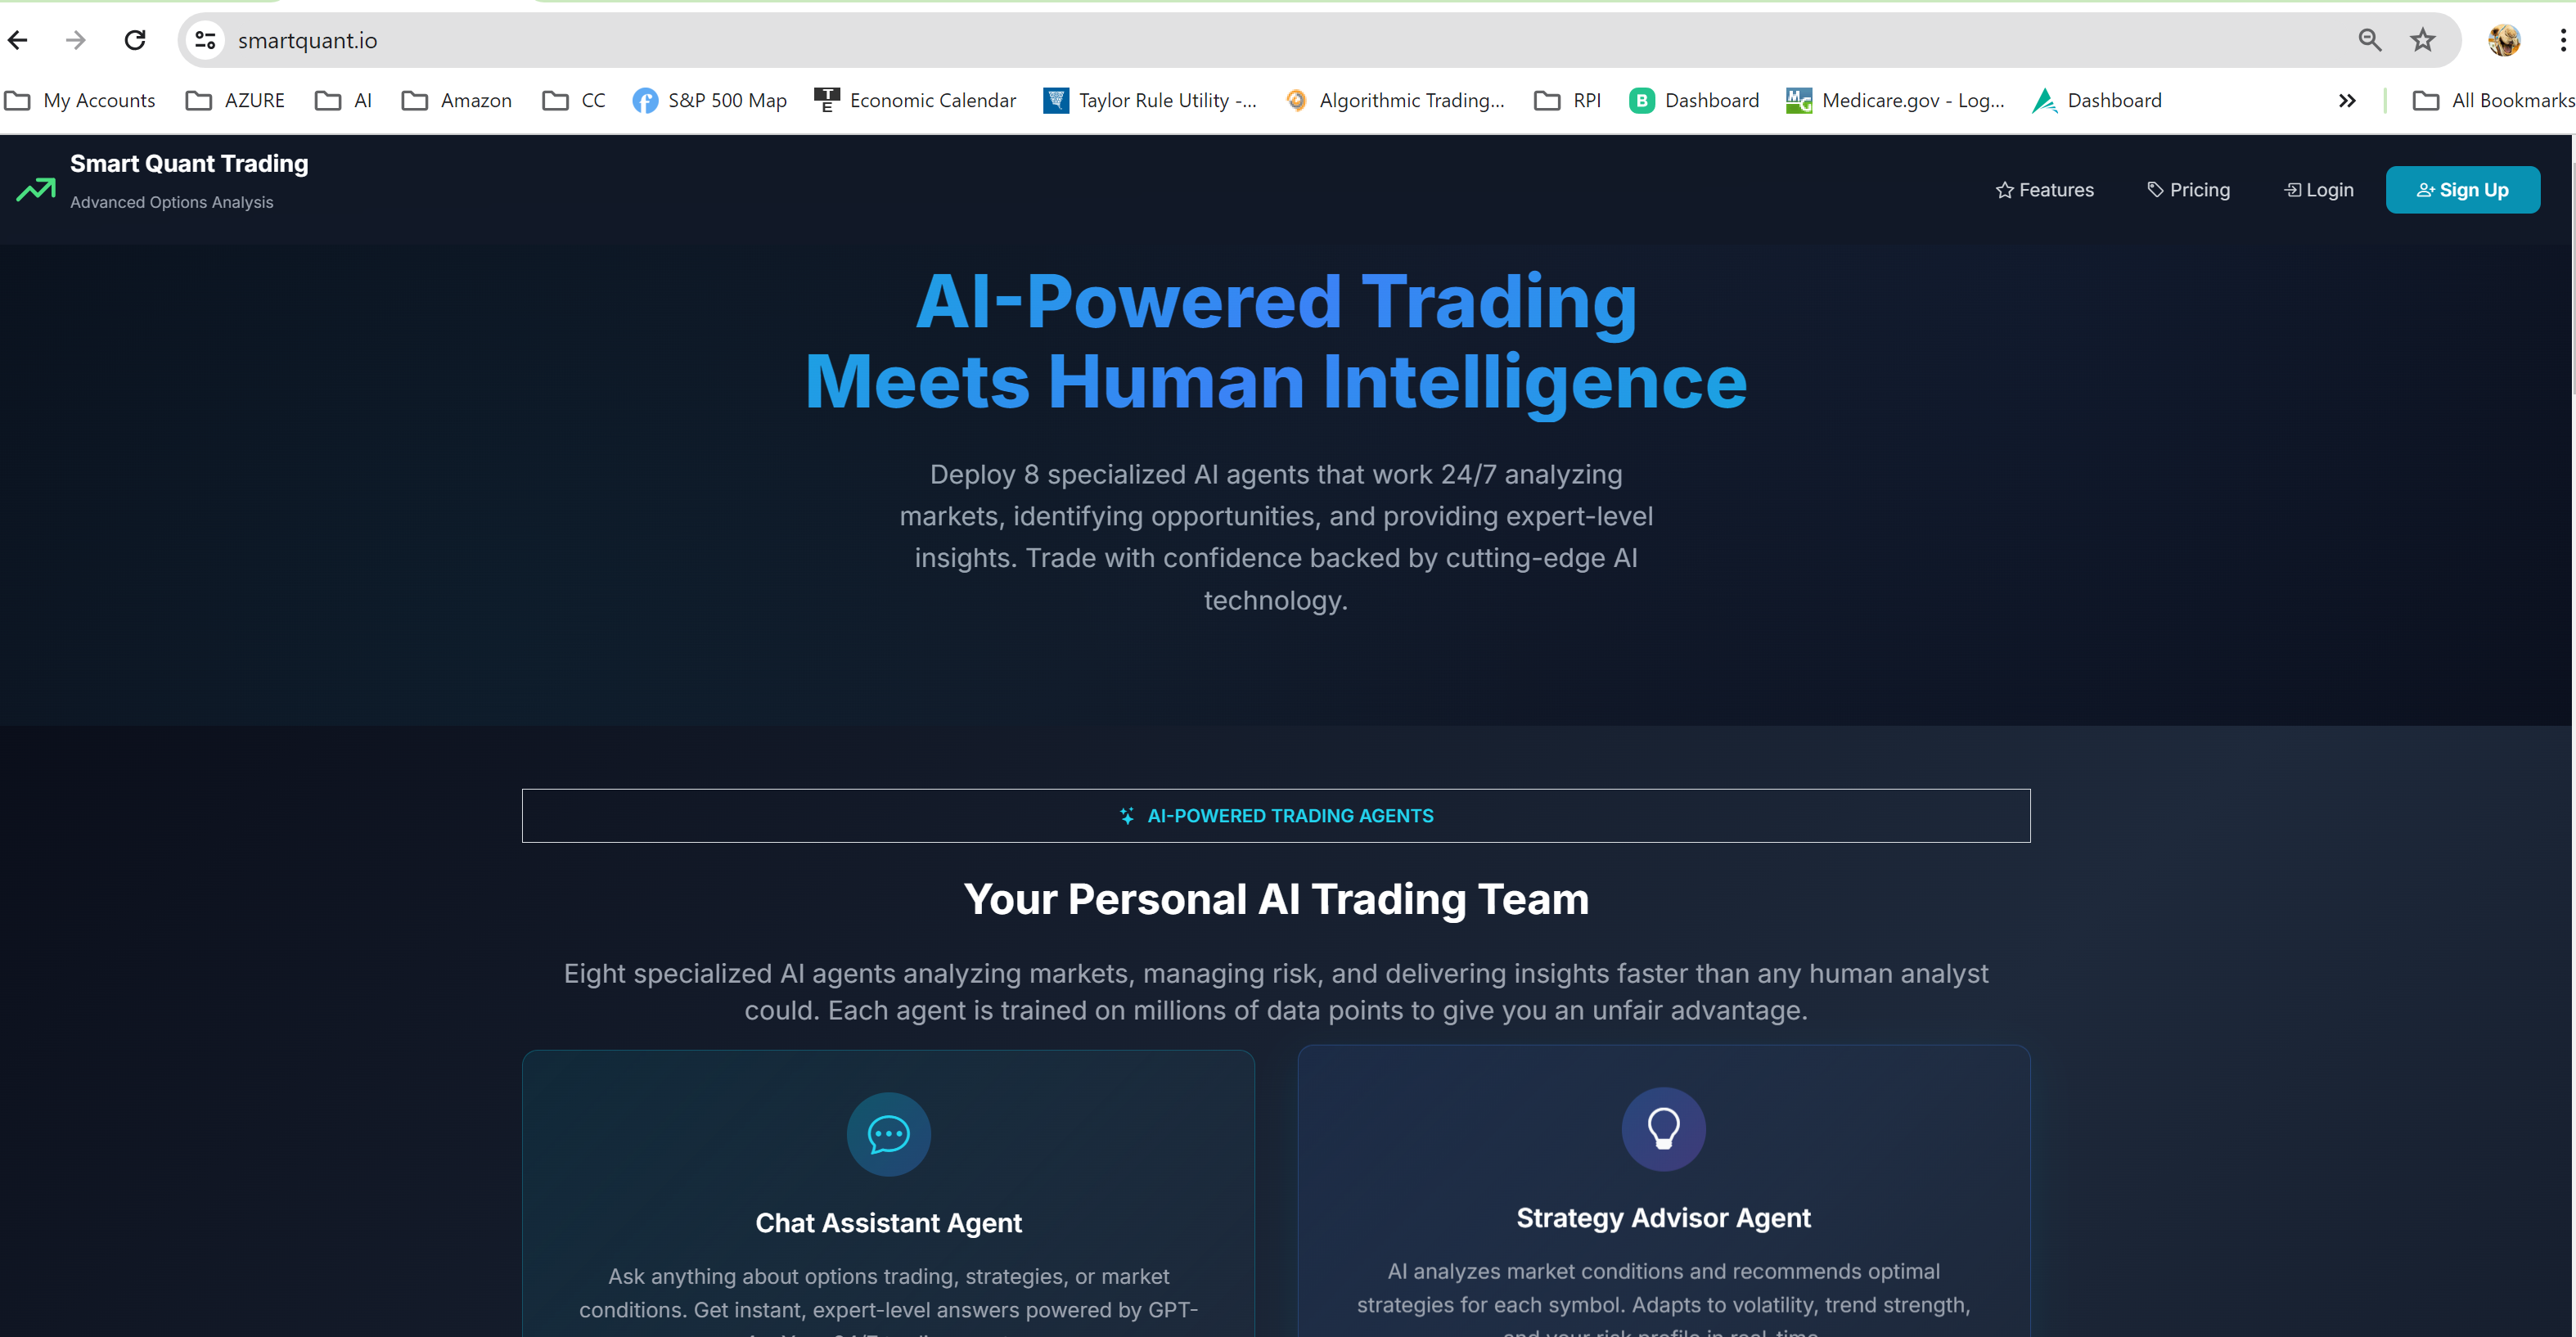
Start: Your Dashboard
Your dashboard shows recent opportunities, market activity, and quick access to all research tools. This is your starting point — a clean interface to begin scanning for opportunities or reviewing your watchlist.
Why This Matters
You need a central place to start your research without information overload. The dashboard focuses on actionable data, not noise.
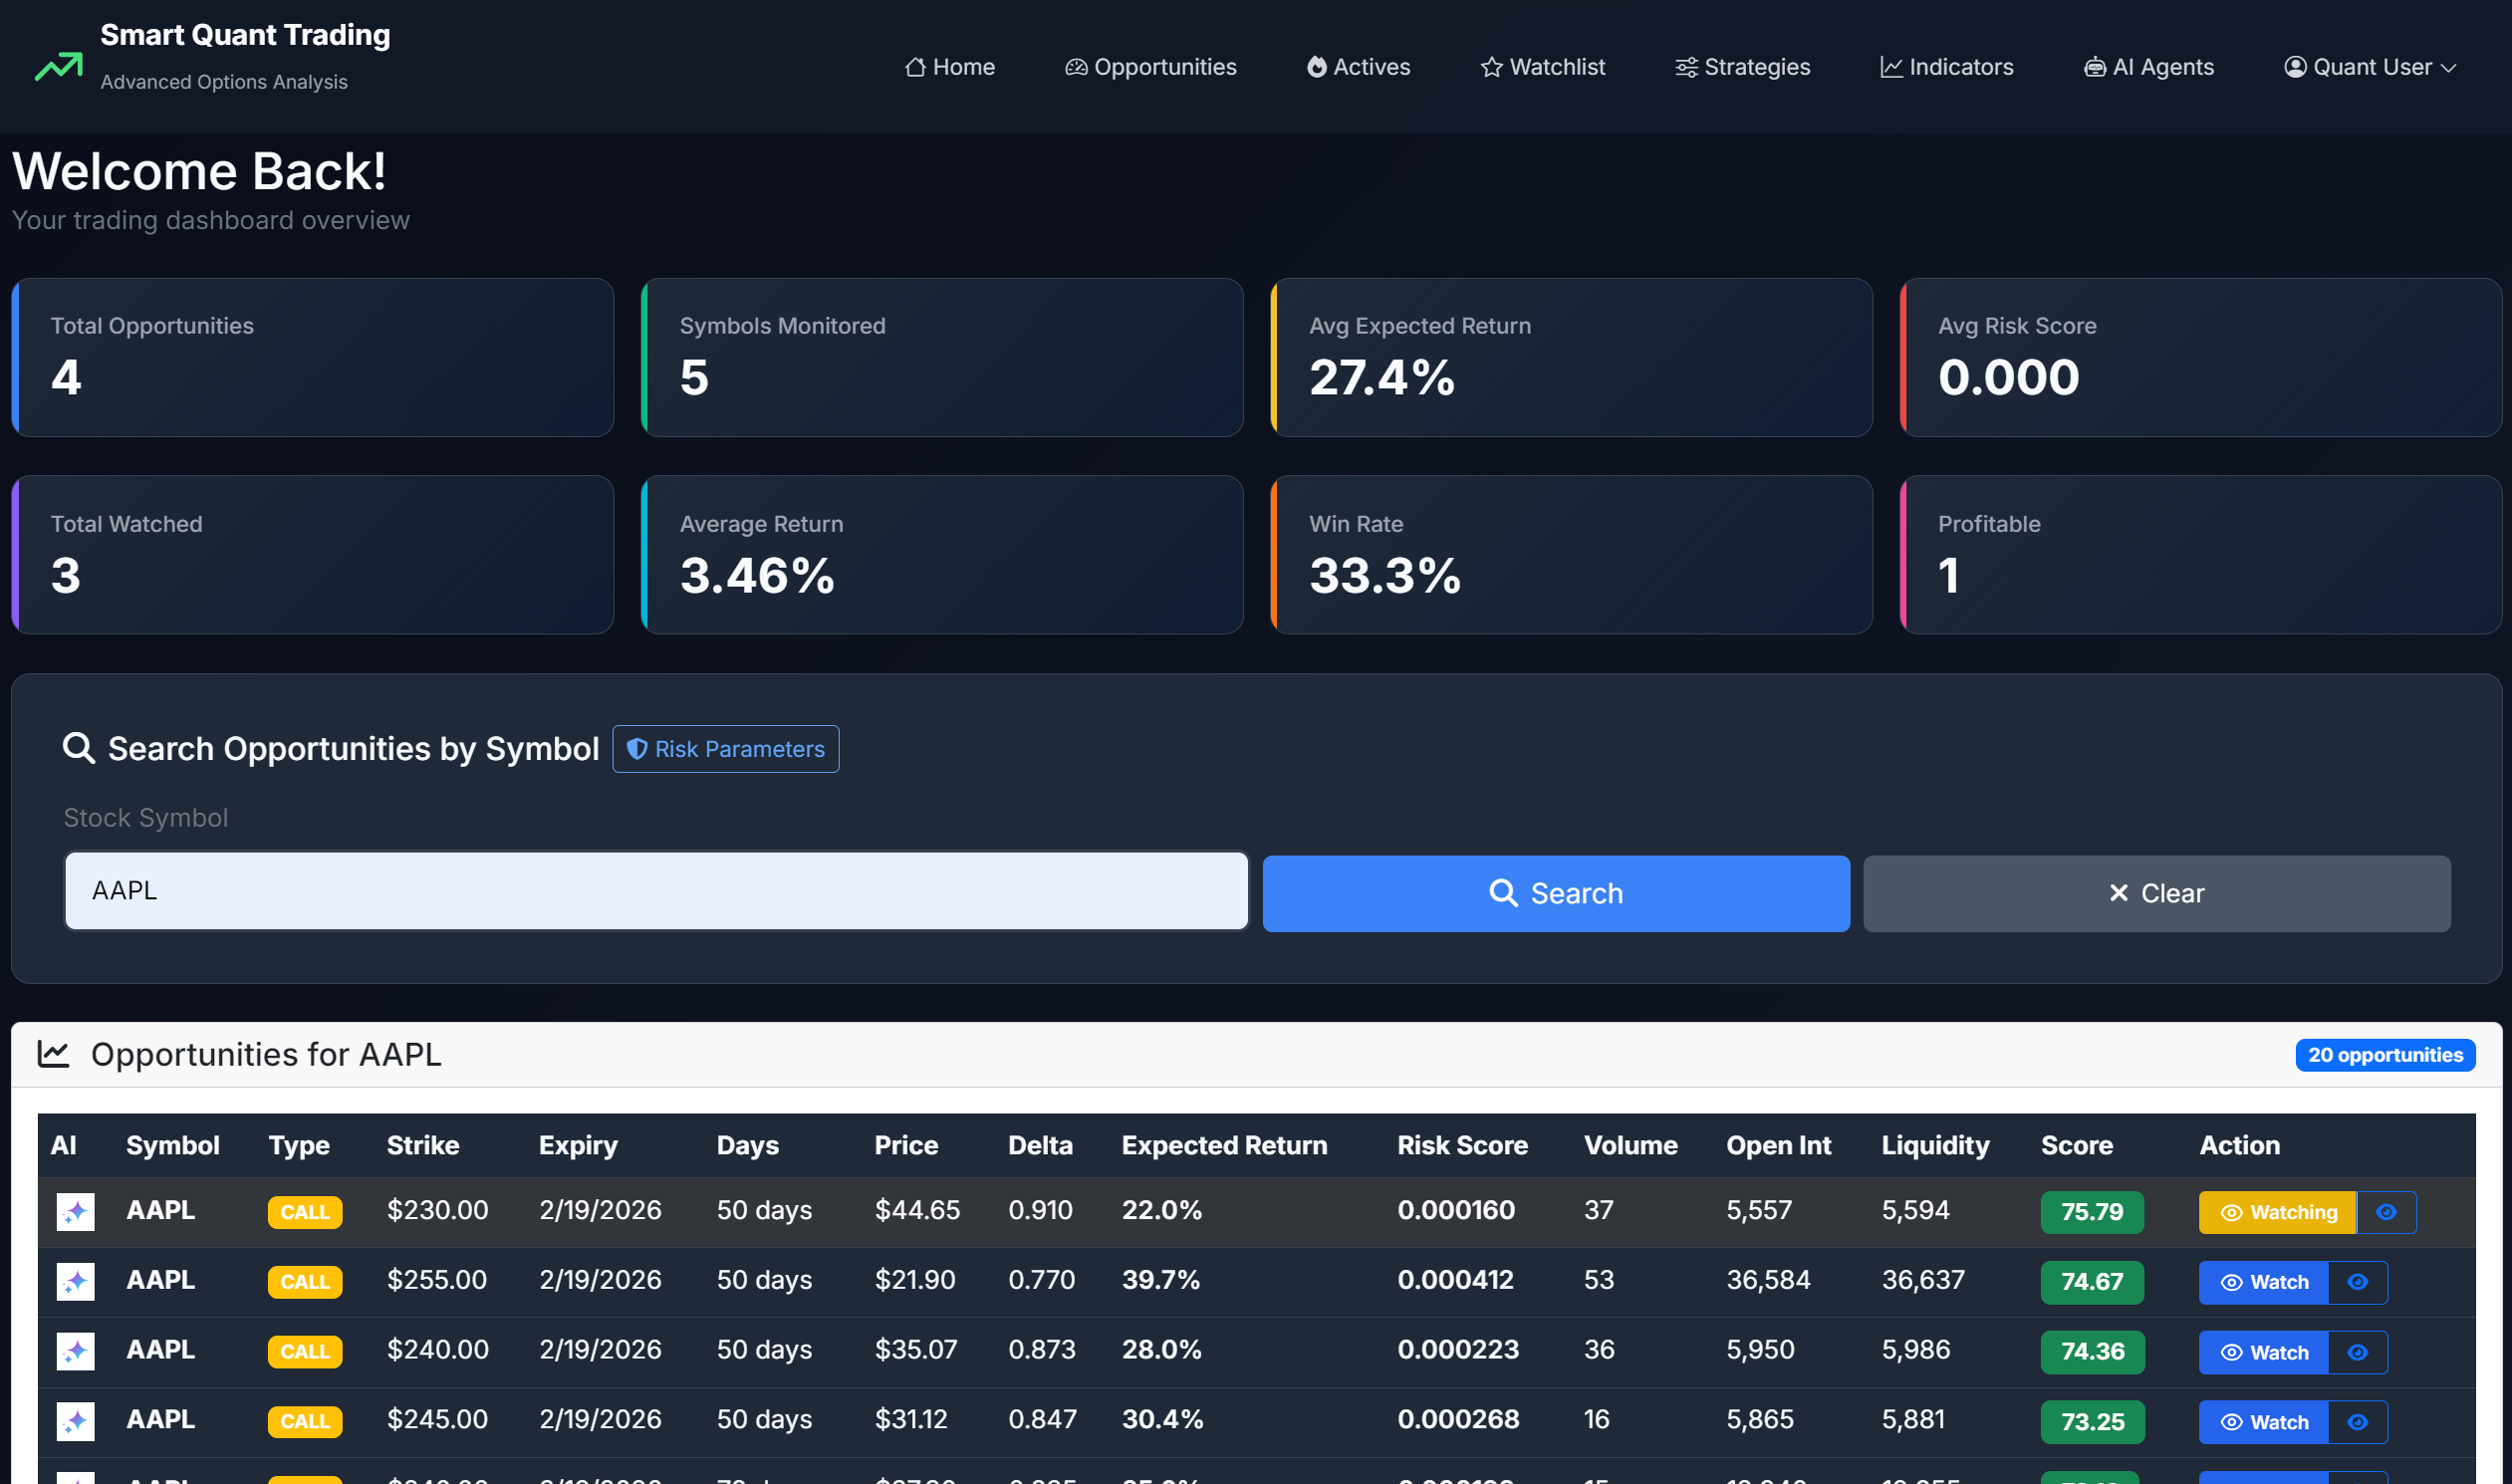
Find: Search for Opportunities
Enter any stock symbol (NVDA, AAPL, TSLA) to scan its options chain. SmartQuant analyzes hundreds of contracts and ranks them by opportunity score based on volatility, liquidity, risk/reward ratio, and probability of profit. Results show the most promising setups first — saving you hours of manual screening.
Why This Matters
Manually screening 500 options contracts per stock takes hours. Automated scoring surfaces the top 10-20 opportunities worth investigating in seconds.
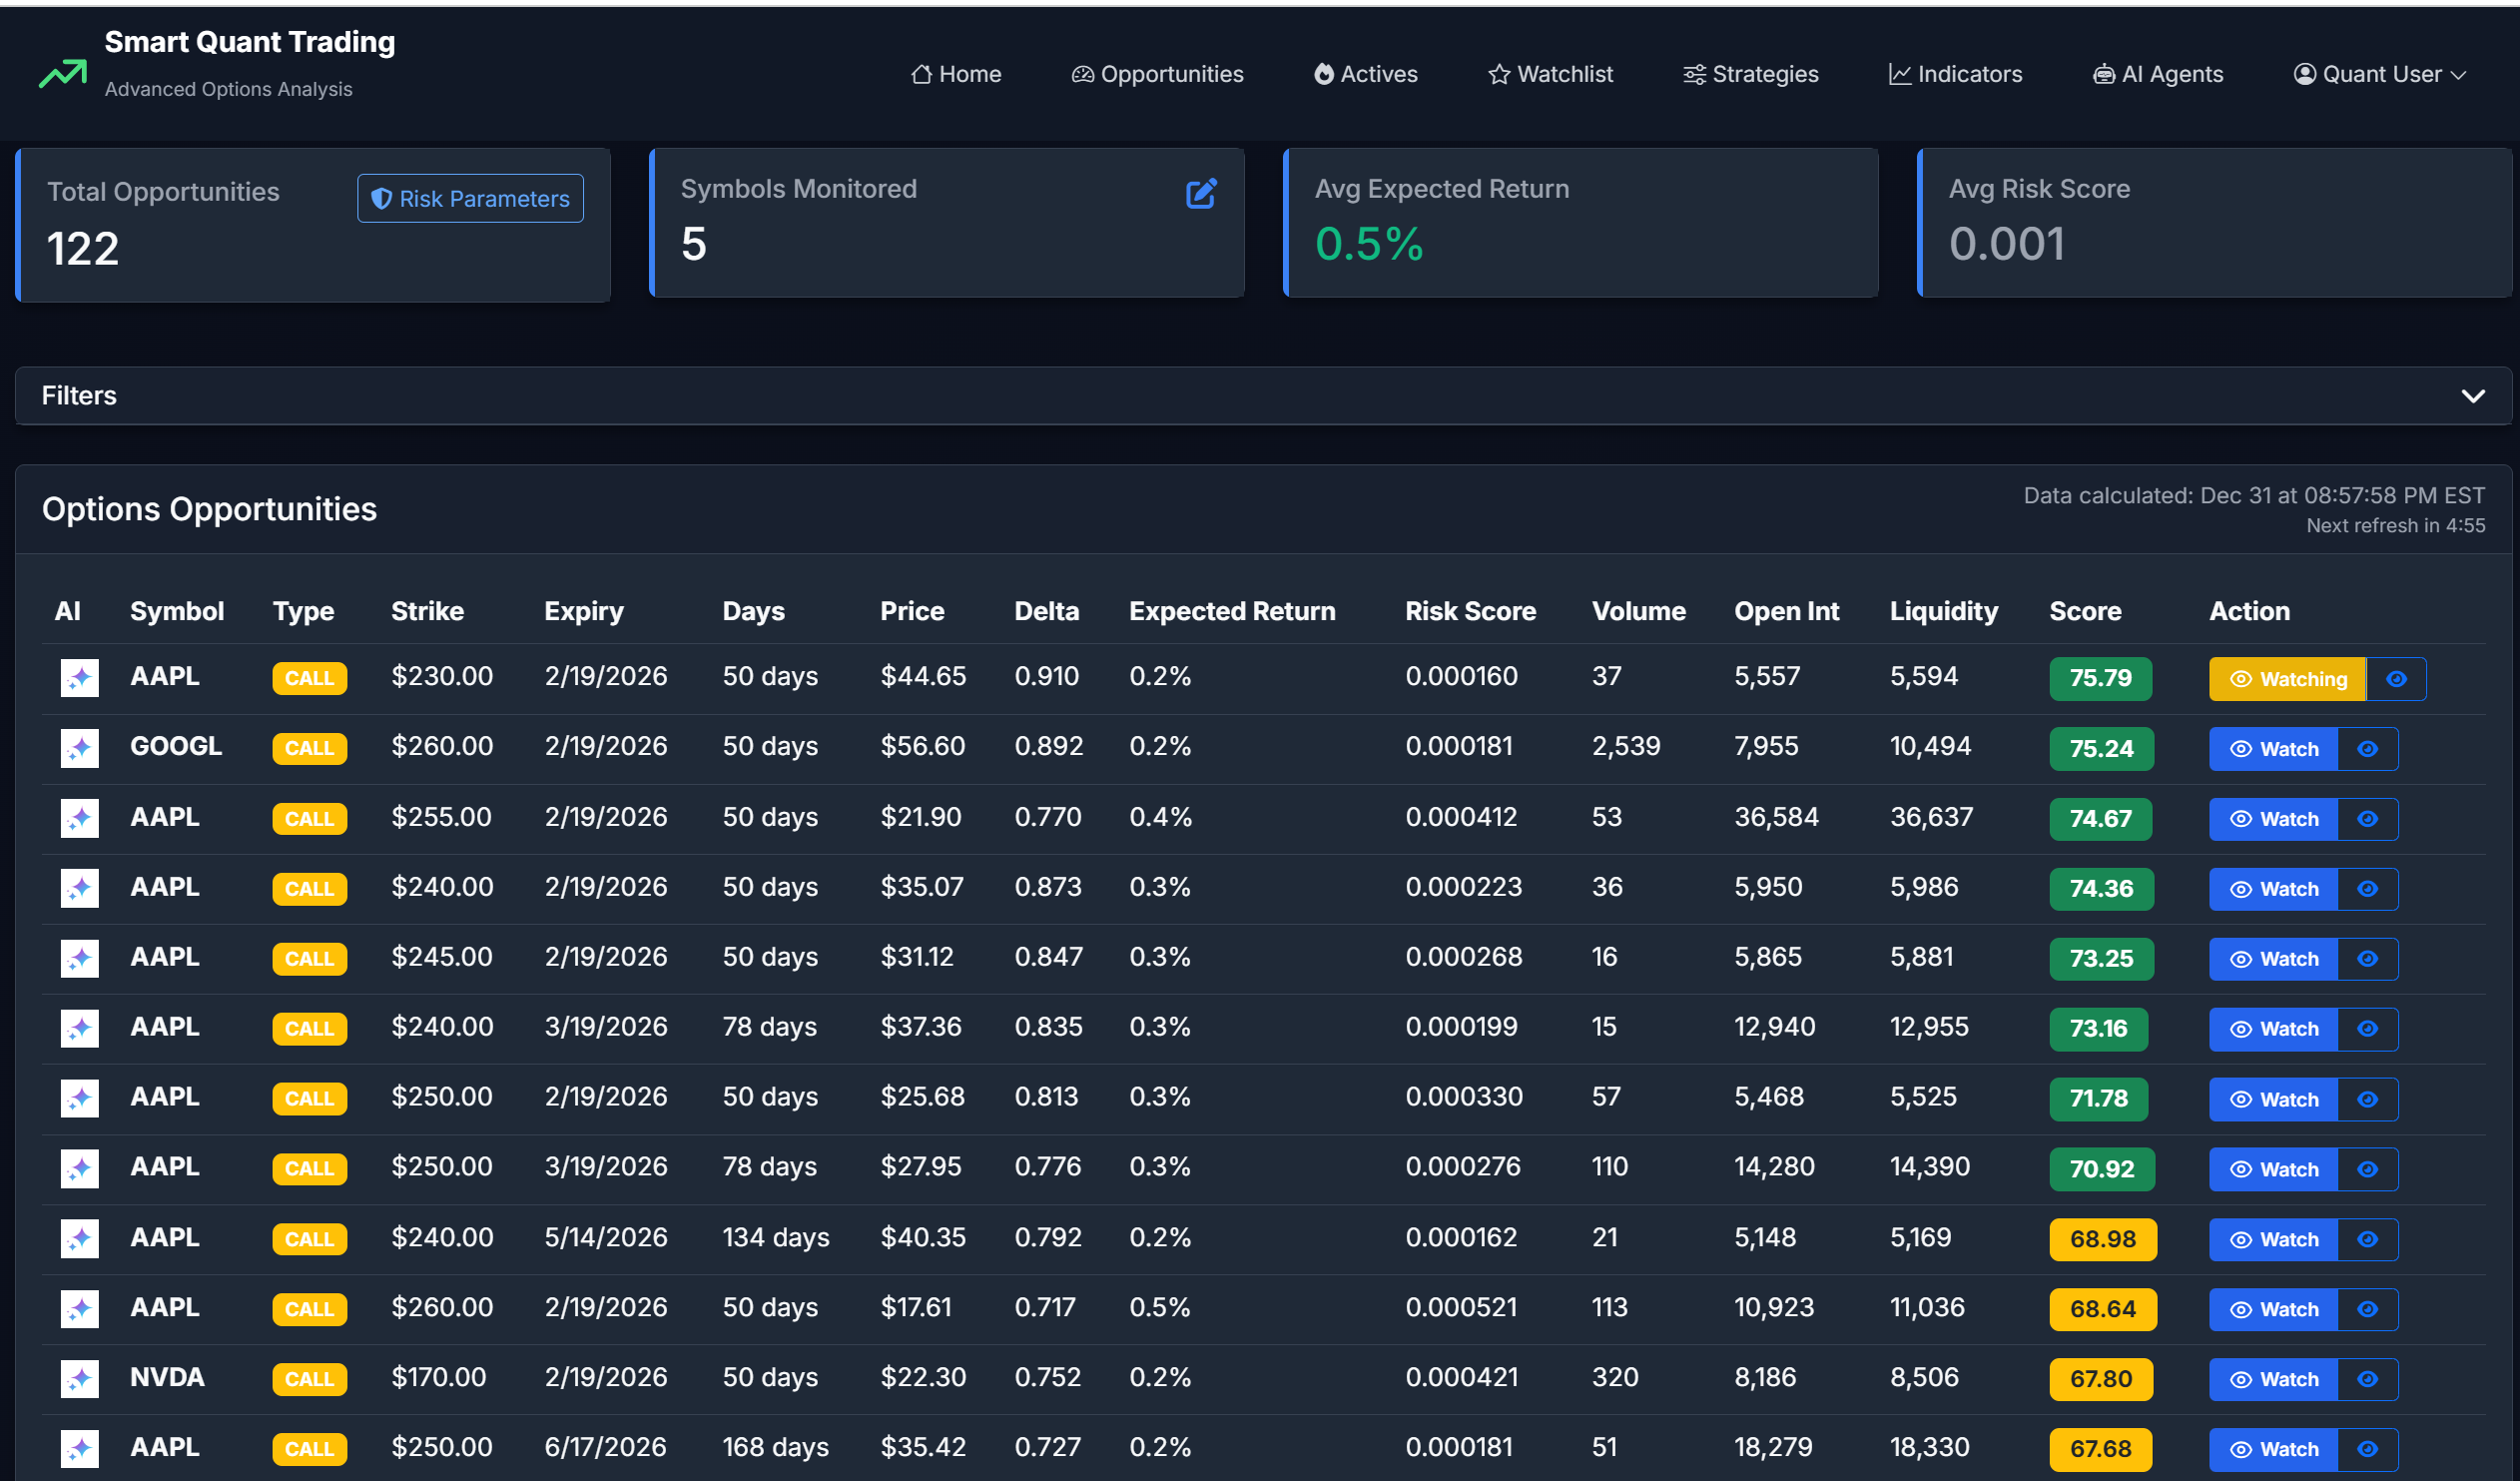
Find: Browse Filtered Results
Review opportunities ranked by score. Each card shows the symbol, strategy type (call spread, iron condor, etc.), strike prices, expiration, and composite score. Filter by strategy, expiration date, or risk level to narrow results. Click "Details" to see full analysis or "AI Analysis" for detailed breakdown.
Why This Matters
You want to quickly identify which opportunities match your strategy and risk tolerance without analyzing every contract manually. Filtering saves time and keeps you focused.
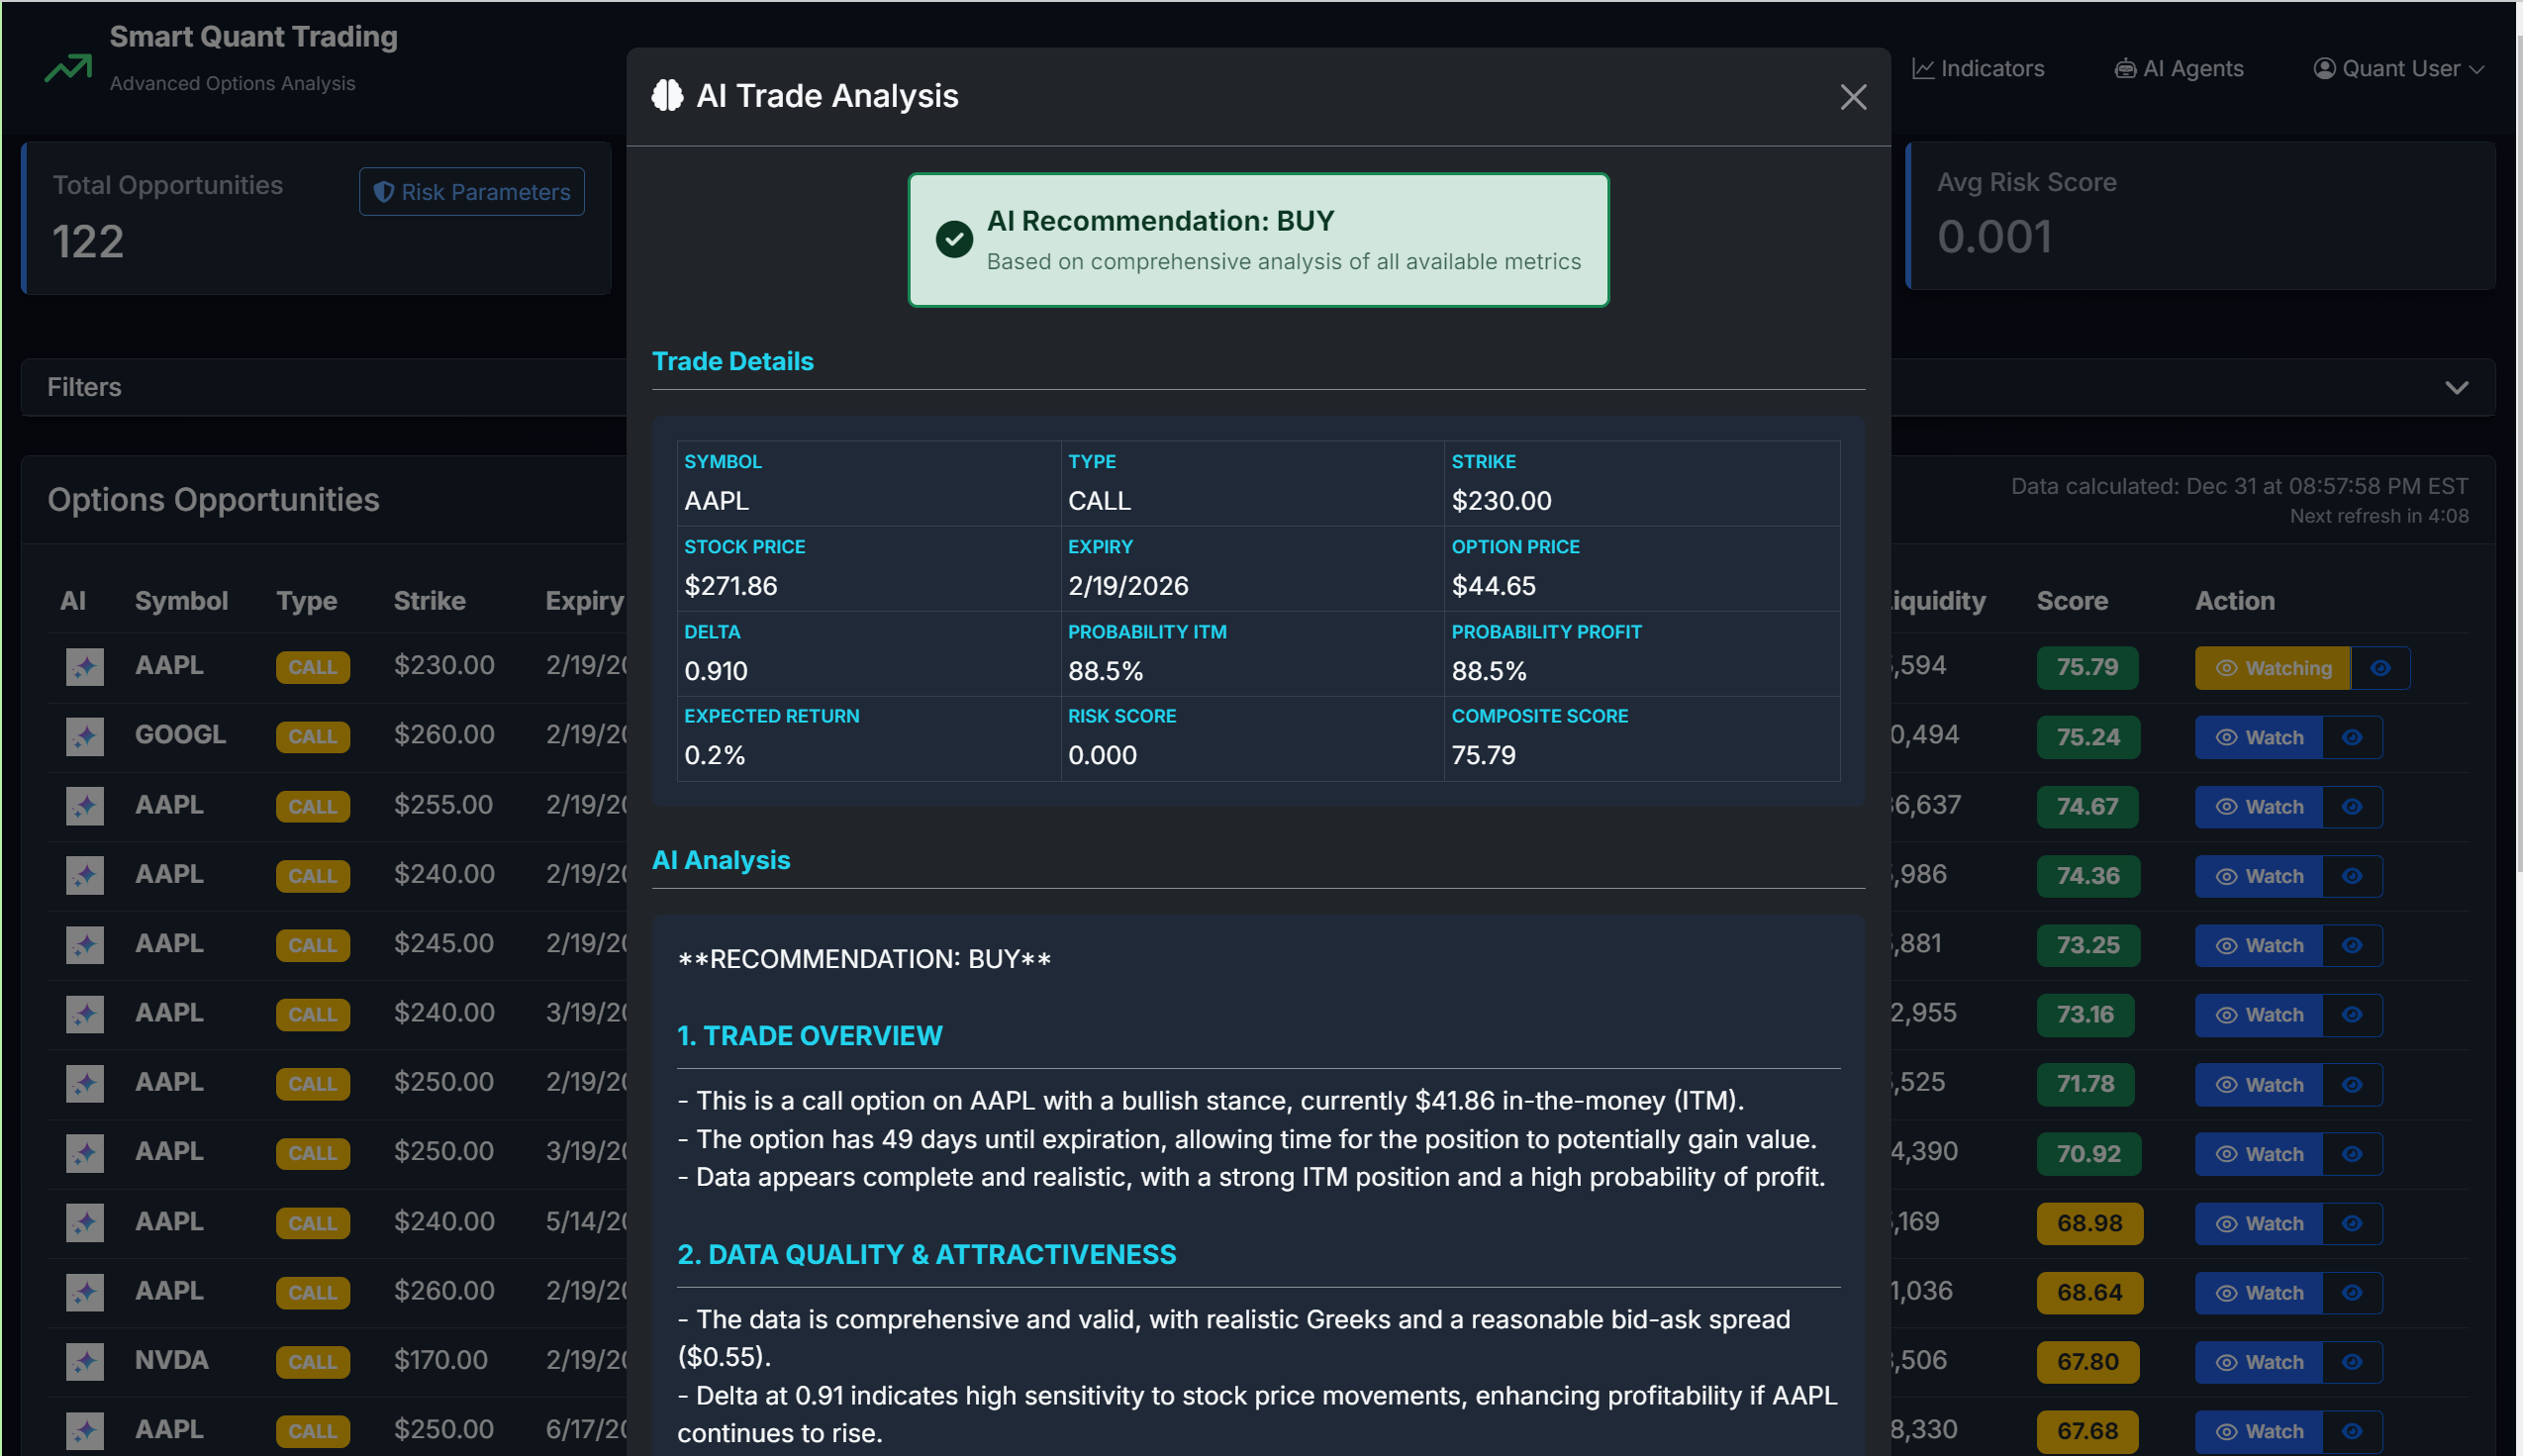
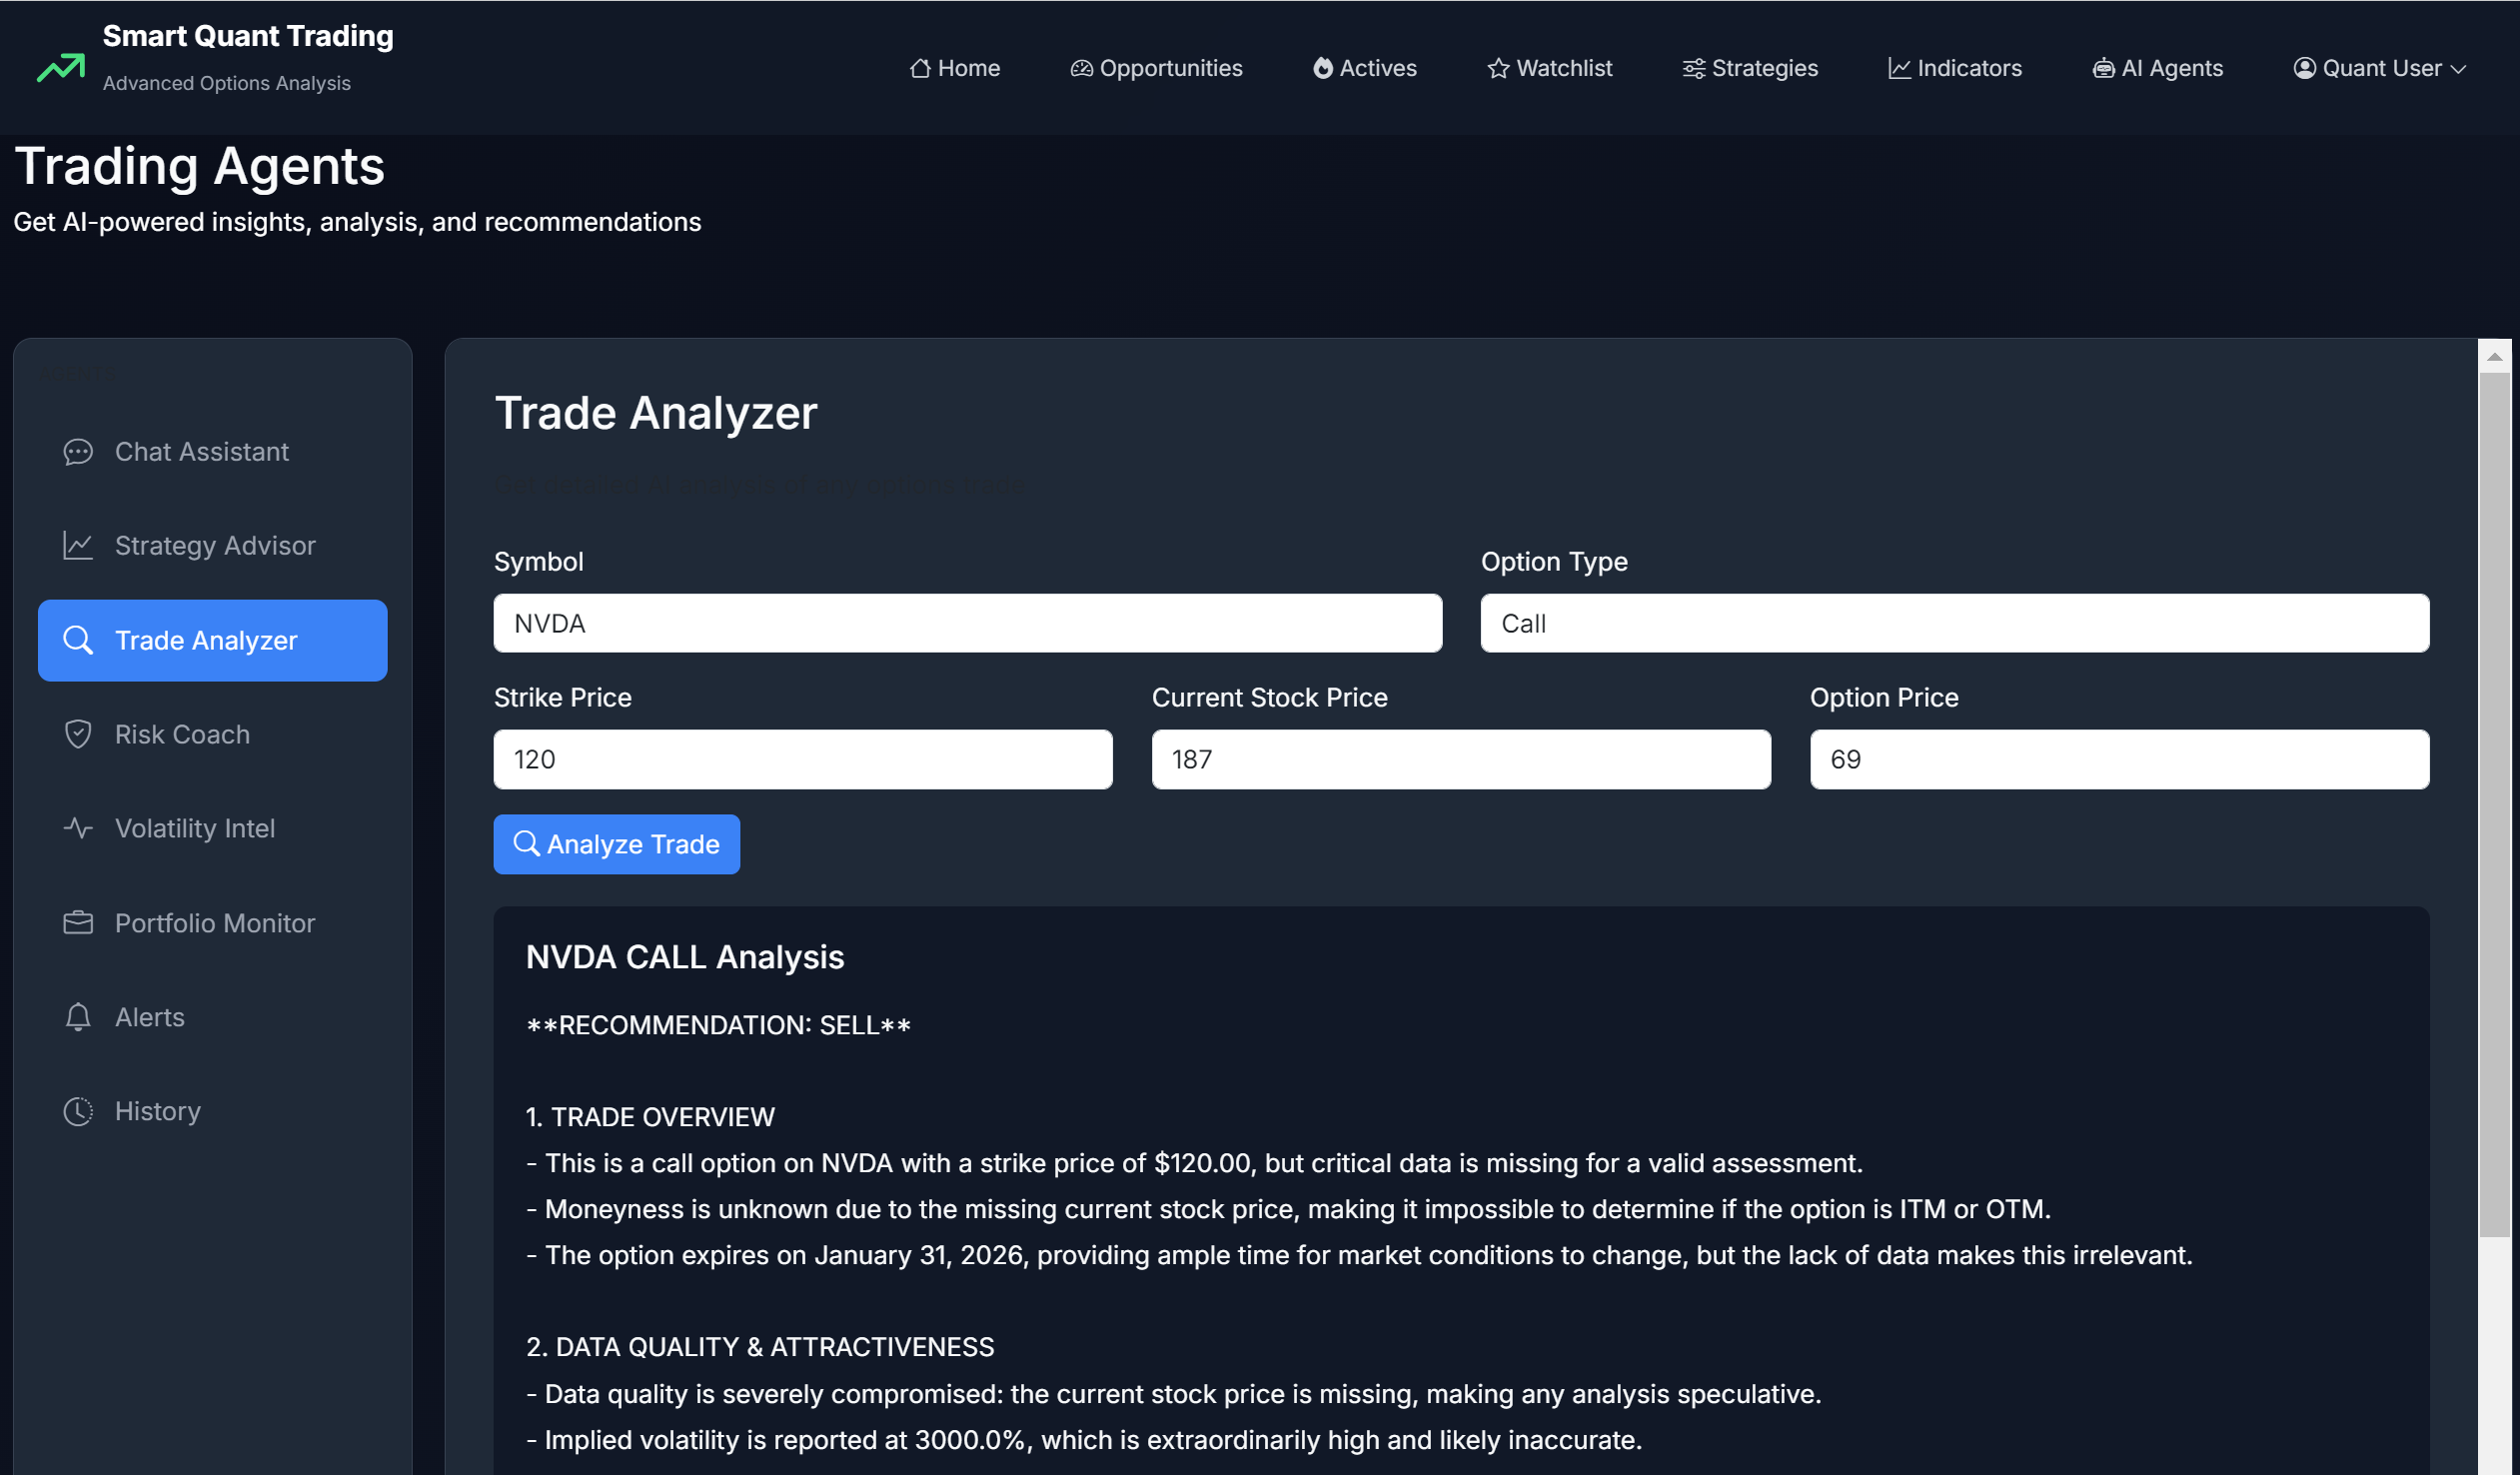
Evaluate: Get Detailed Analysis
Click the analysis button to see a breakdown of the opportunity covering market conditions, volatility environment, technical setup, and risk considerations. The analysis explains what could go right, what could go wrong, and key factors to watch. Use this as one input in your decision — not as standalone advice.
Why This Matters
You need to understand WHY a trade might work or fail before risking capital. Detailed analysis helps you spot risks you might have missed and validate your thesis.
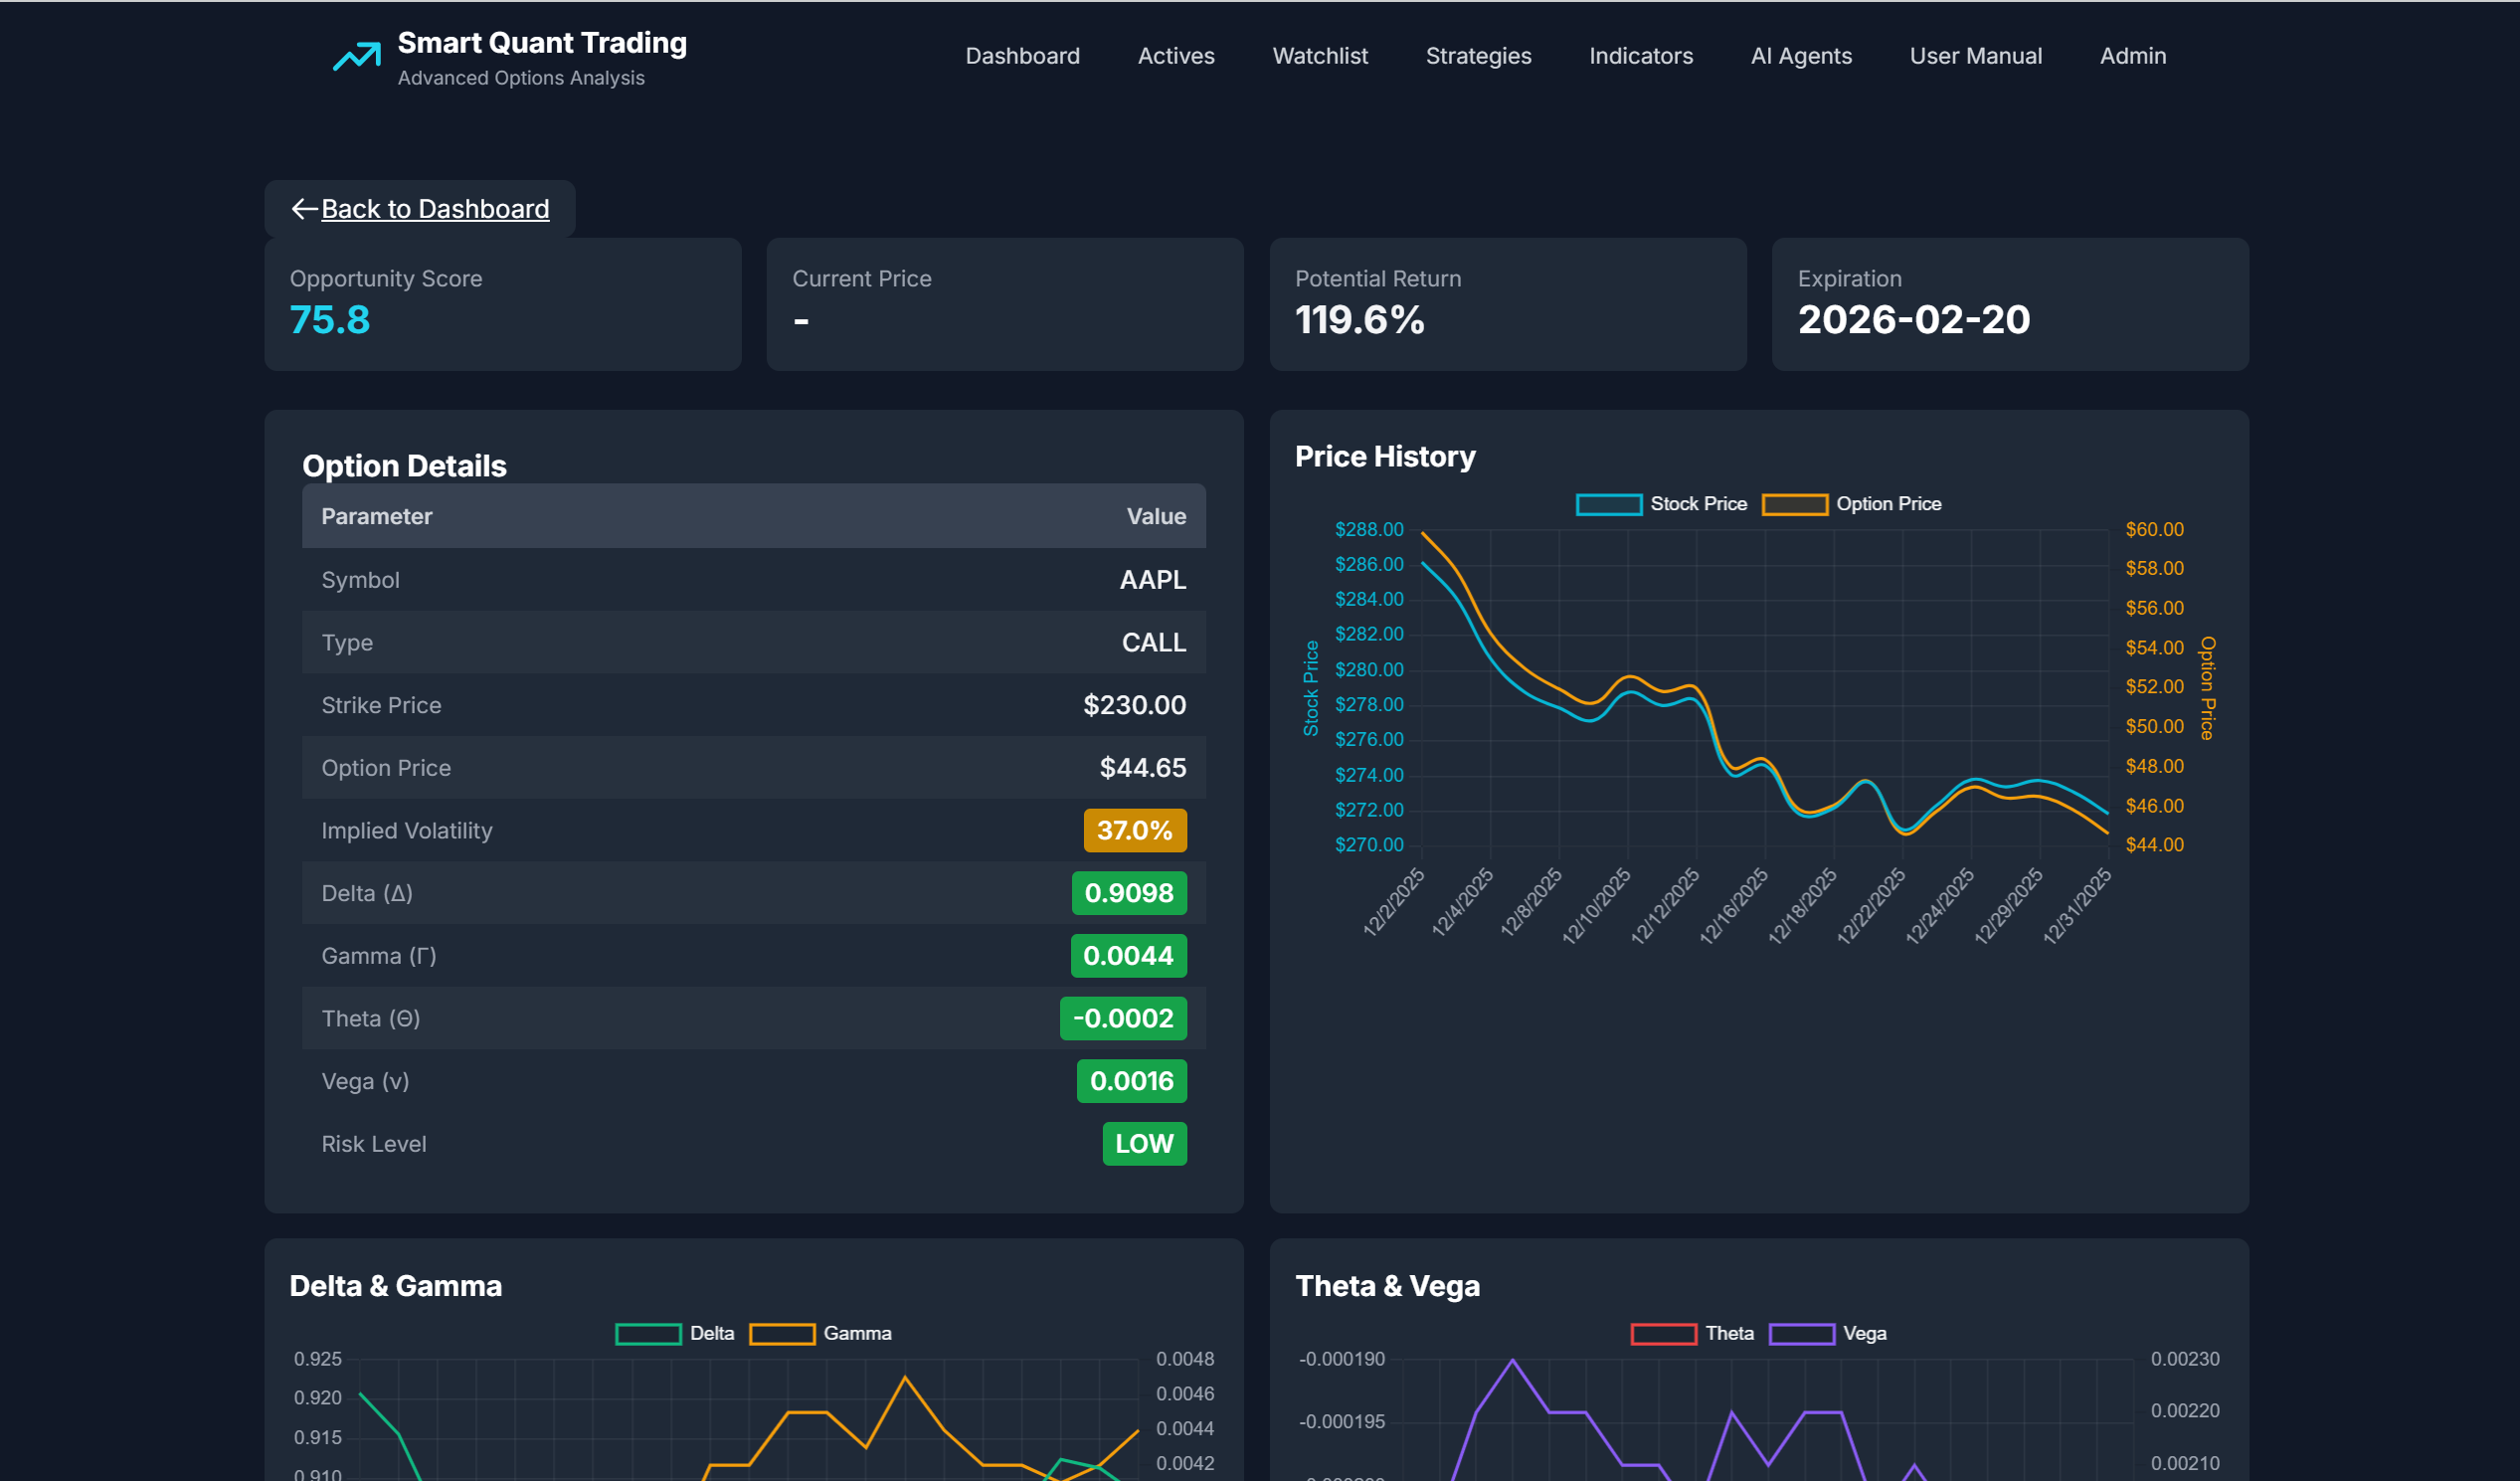
Understand: See Complete Risk Metrics
View detailed Greeks (Delta, Gamma, Theta, Vega) with trend charts, probability of profit calculations, max profit/loss scenarios, breakeven points, and IV rank. Interactive charts show historical price movements and options chain data. All metrics update in real-time during market hours so you see current risk levels.
Why This Matters
You need to know your maximum loss, breakeven points, and how Greeks will affect your P&L BEFORE entering the trade. One overlooked metric can turn a good idea into a disaster.
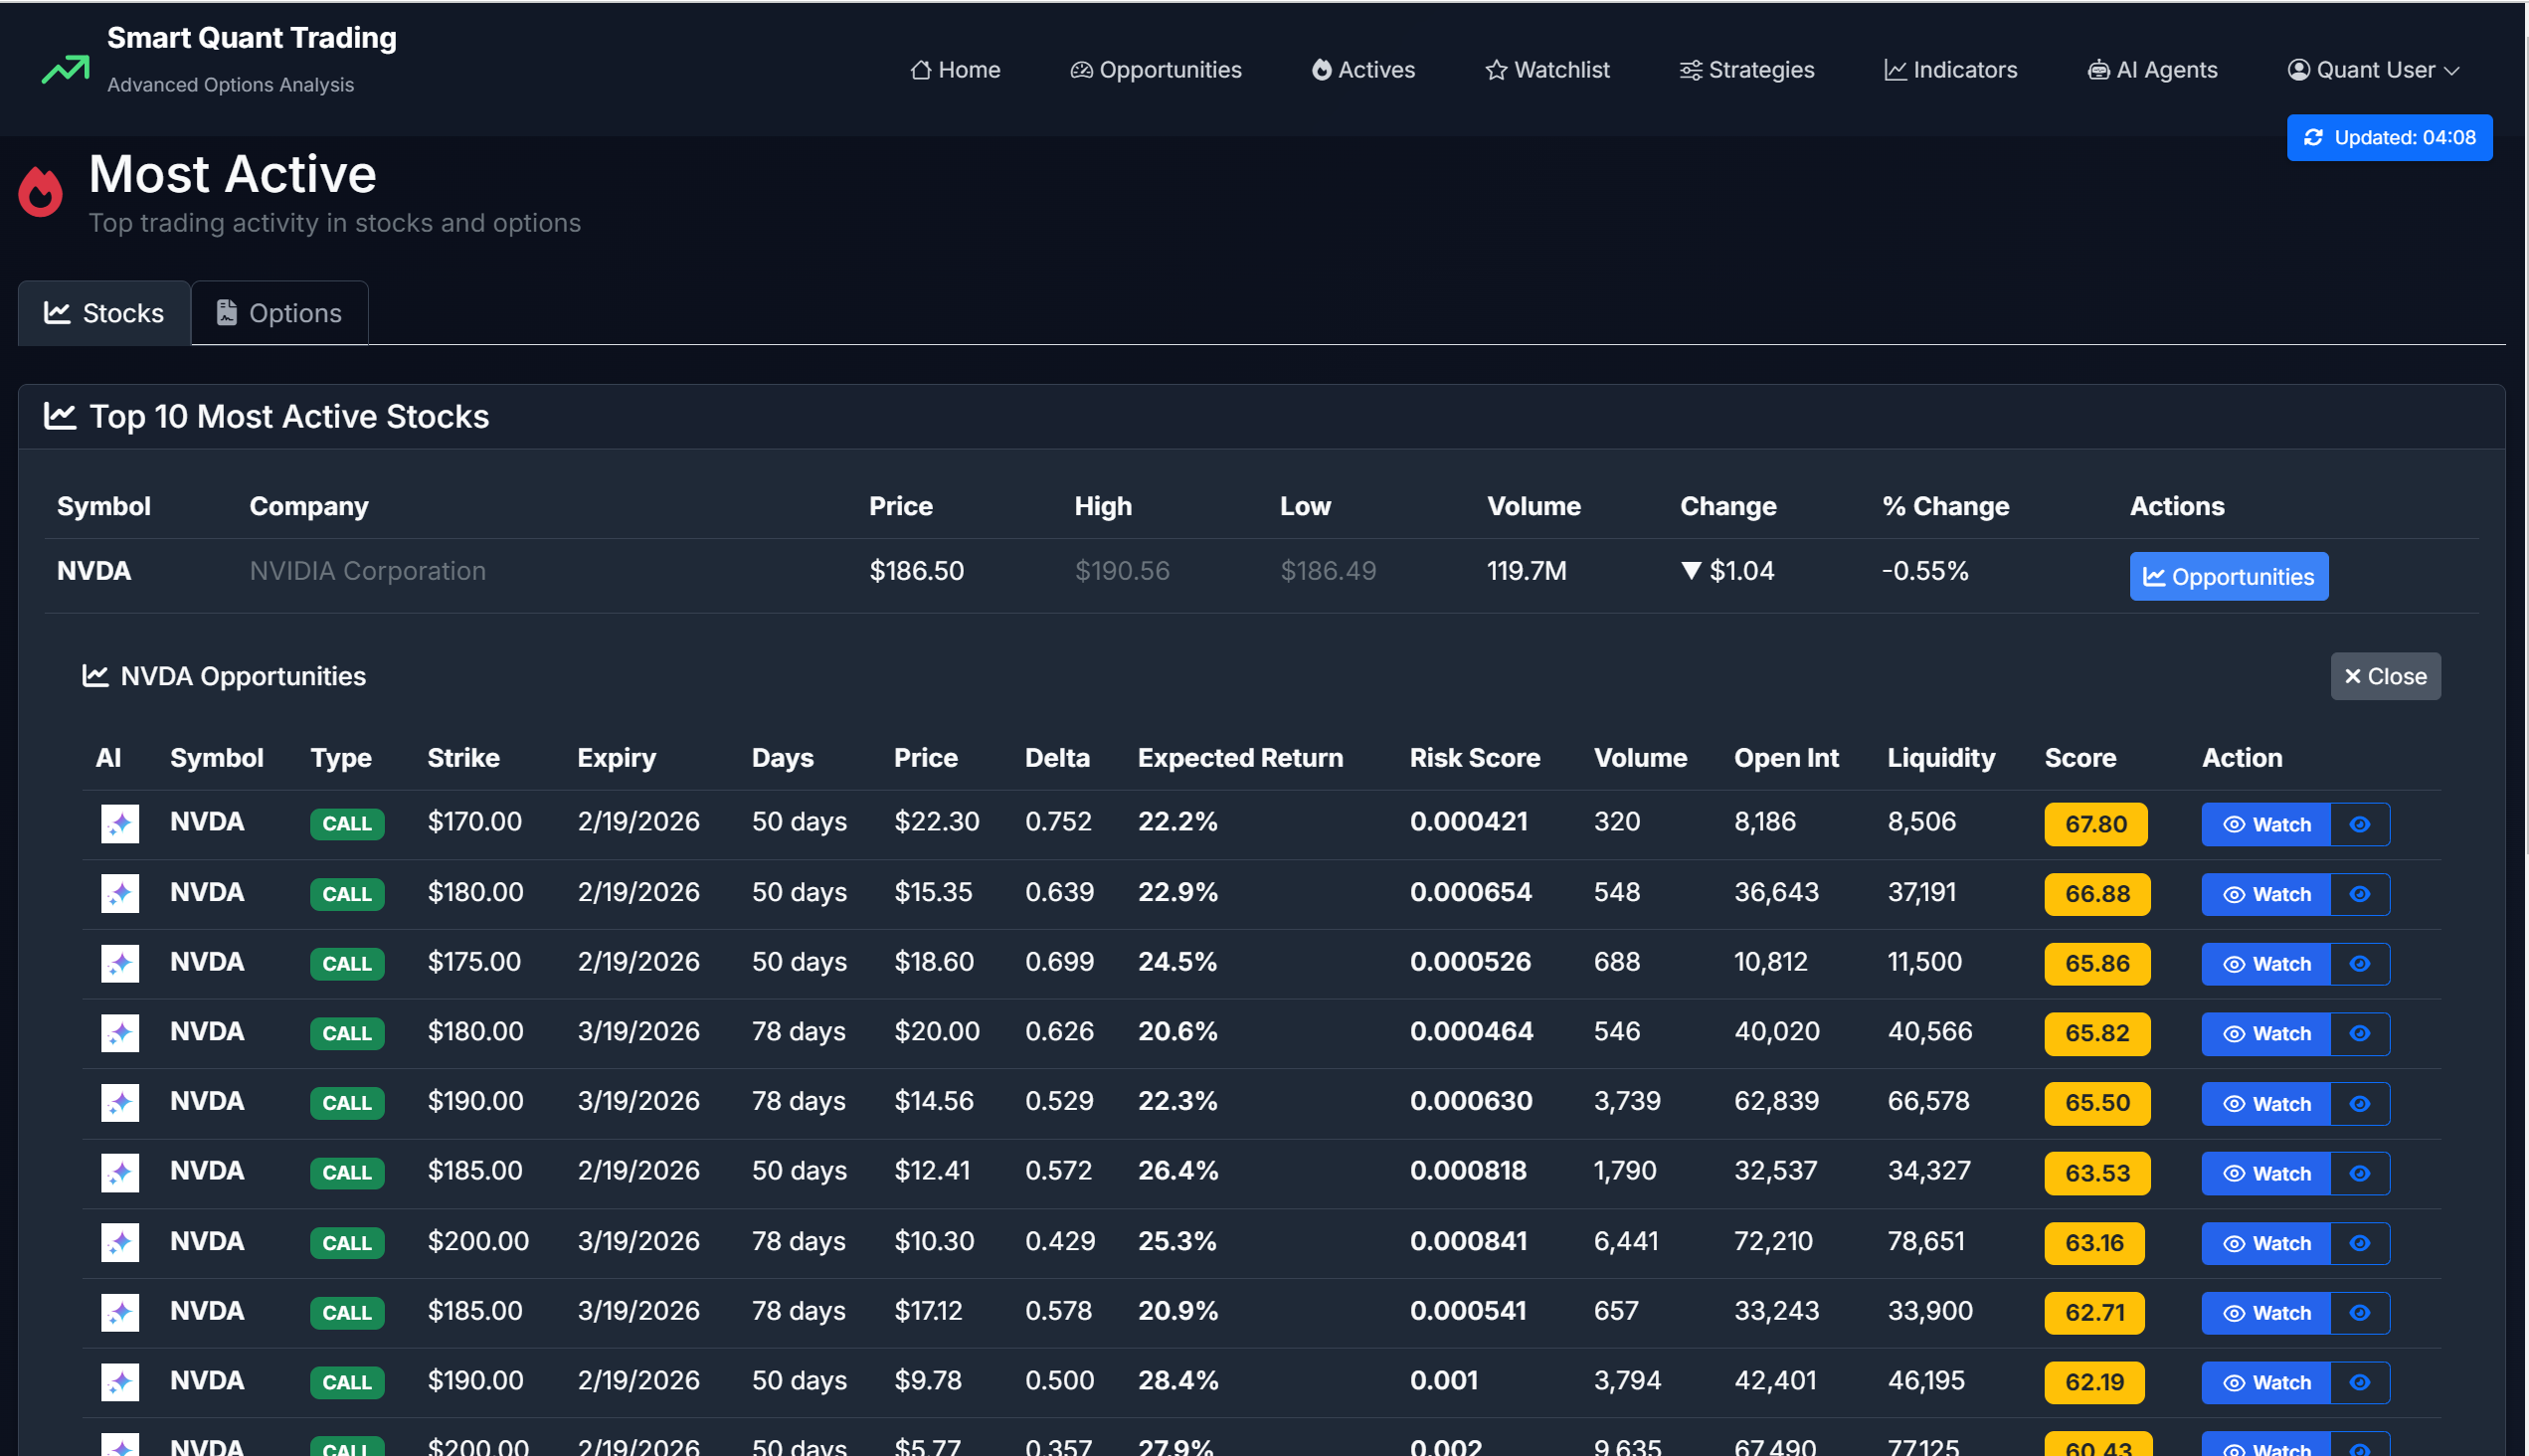
Discover: Monitor Active Stocks
Track stocks with unusual volume, significant price moves, or high options activity. Each entry shows current price, percent change, volume, and related opportunities. Add stocks to your watchlist to monitor them continuously. The feed updates throughout the day to surface emerging opportunities.
Why This Matters
Big moves create options opportunities. Catching a 5% spike early can mean the difference between a profitable trade and missing the setup entirely.
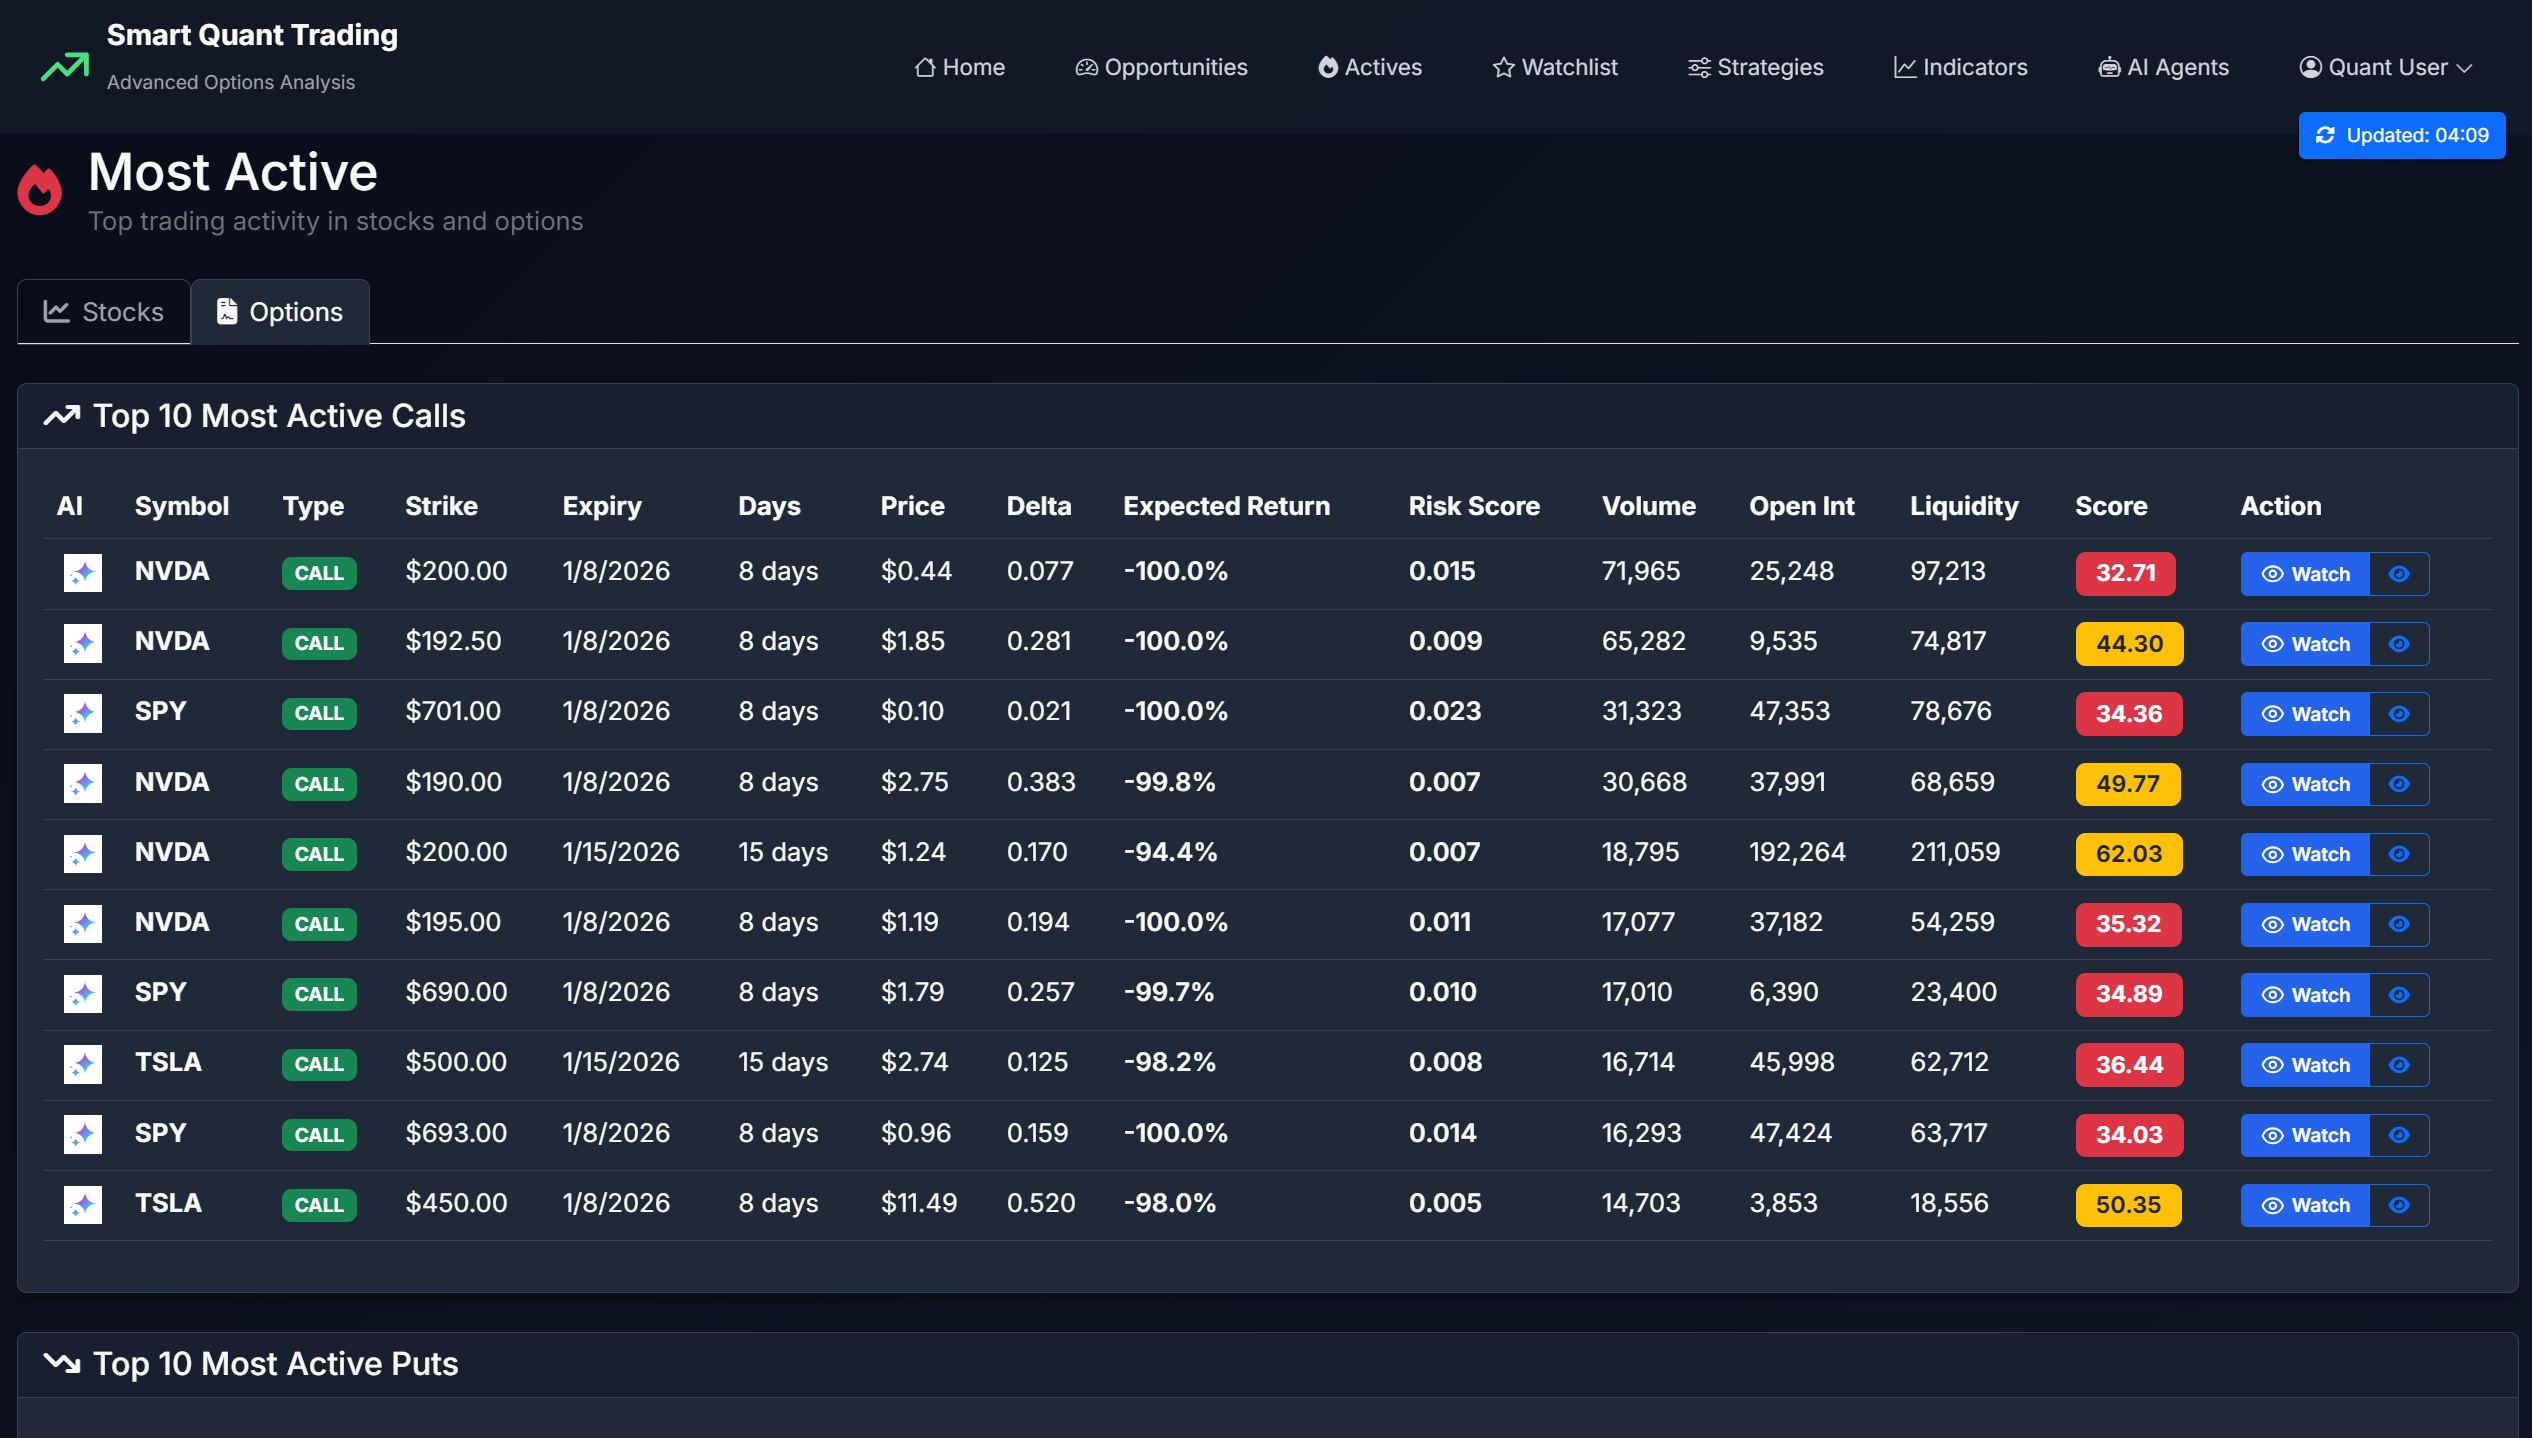
Discover: Track Unusual Options Activity
See options contracts with unusual volume or open interest changes that may indicate institutional activity. Each contract shows strike, expiration, Greeks, volume, and opportunity score. Unusual activity often precedes major price moves — this helps you spot potential setups early.
Why This Matters
When institutions buy 10,000 calls on a stock, they often know something. Tracking unusual activity lets you see what smart money is doing and investigate whether it's relevant to your strategy.
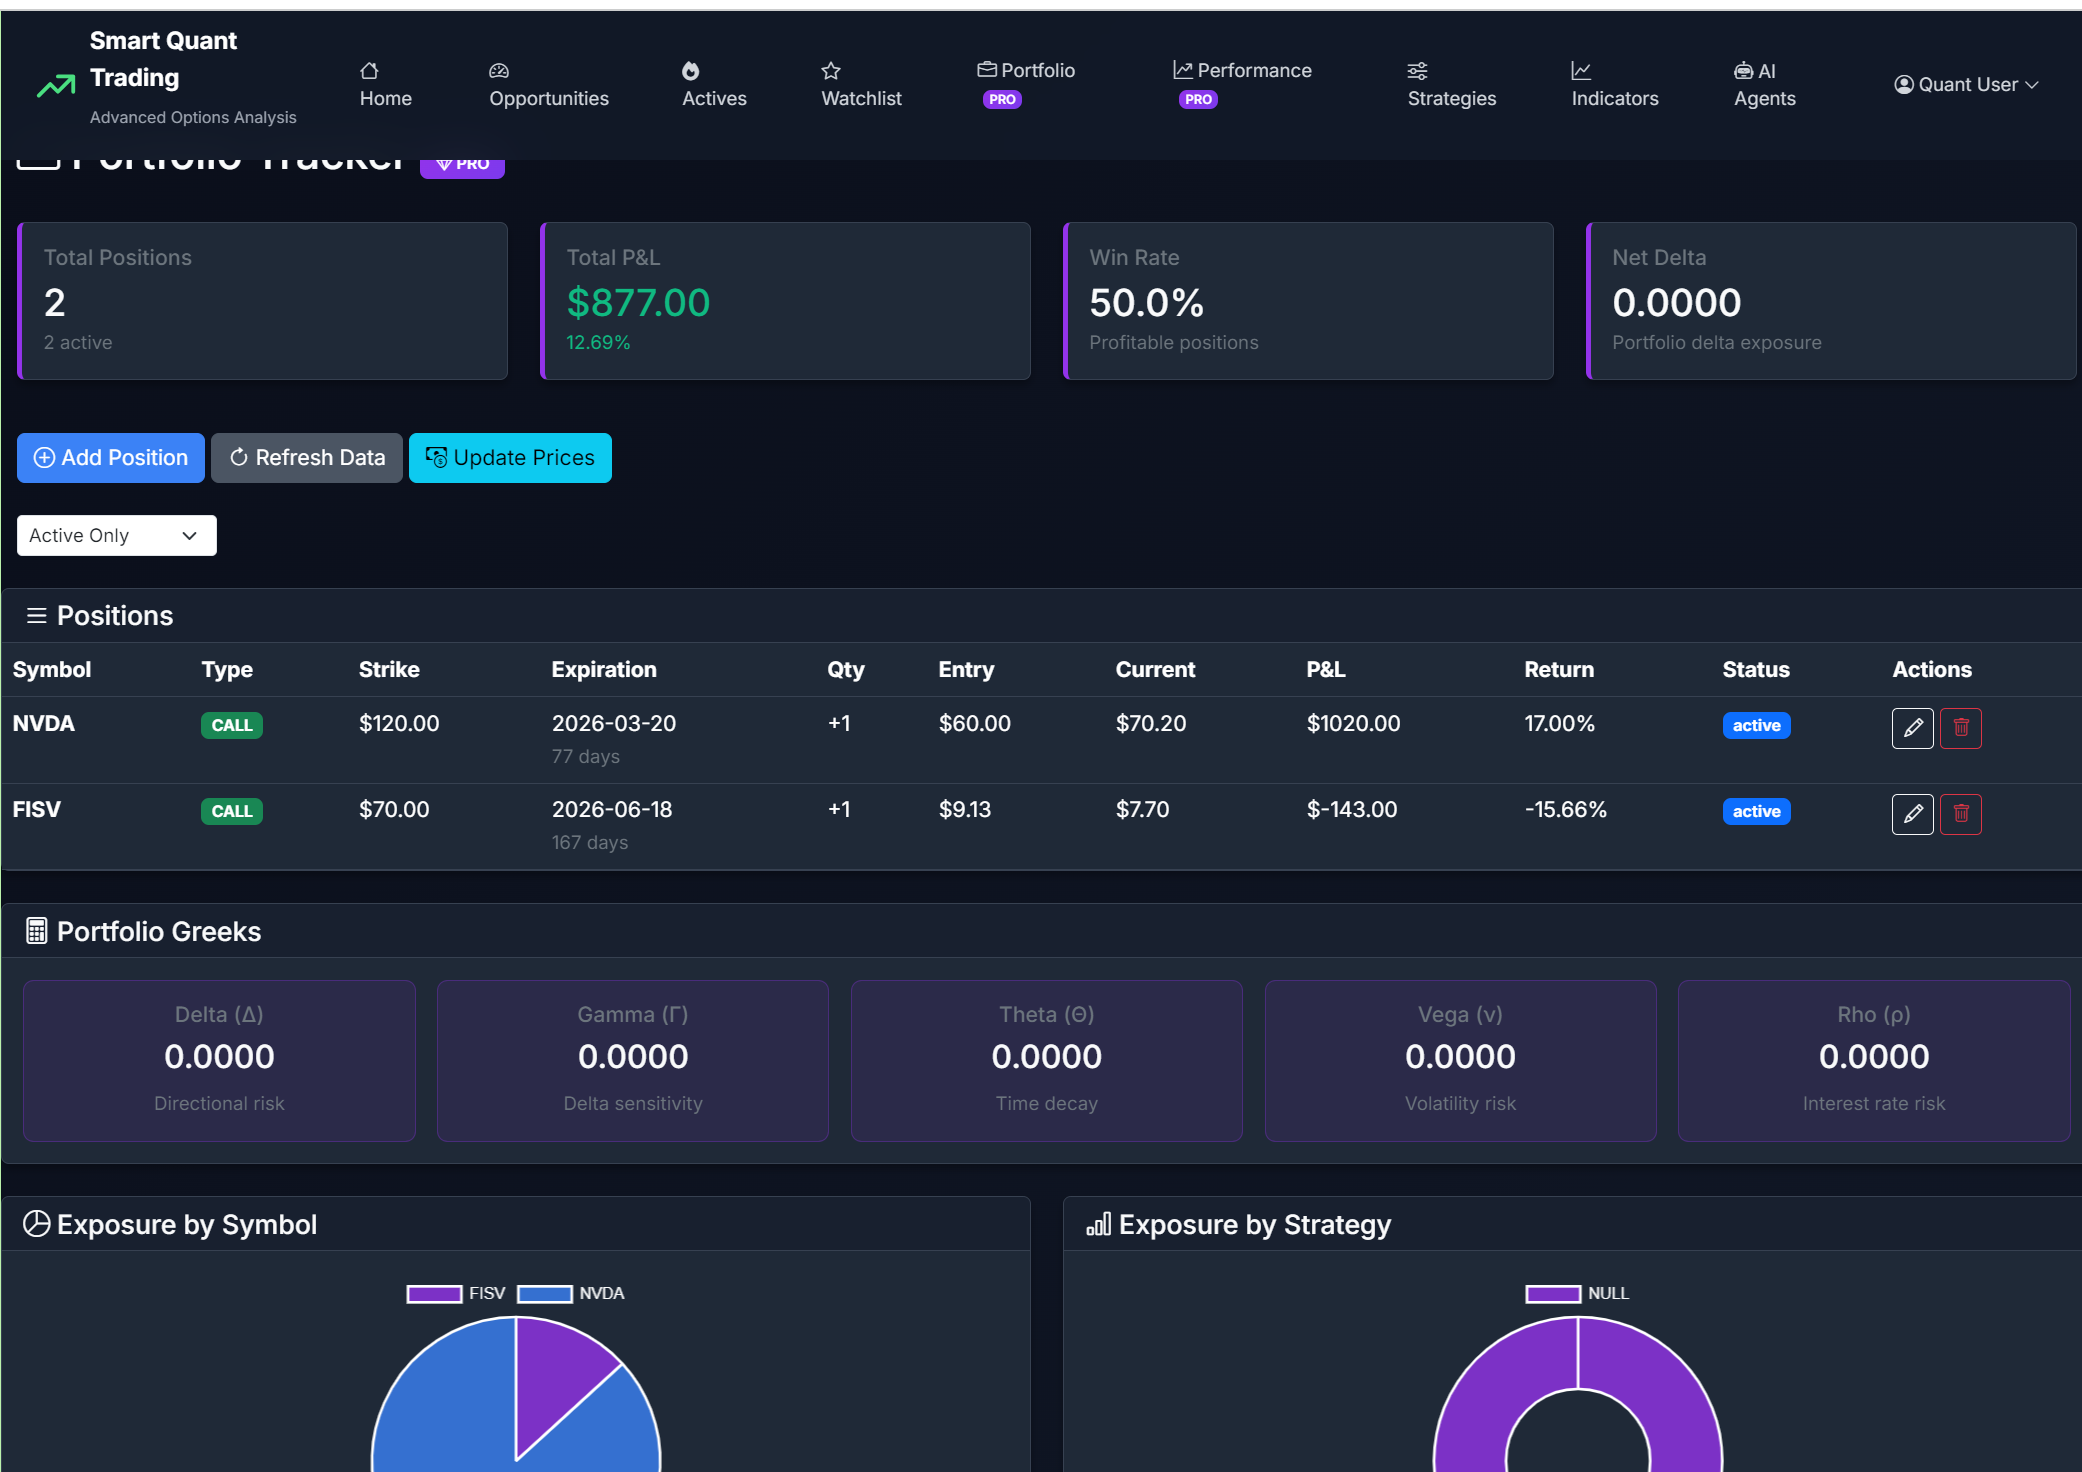
Manage: Track Portfolio Risk (Pro)
Track all positions, P&L, and portfolio-level Greeks exposure in one dashboard. See your net delta, theta, and vega across all positions to avoid over-concentration. Monitor max potential loss, win rate, average profit per trade, and risk-adjusted returns. Generate performance reports and set alerts for portfolio risk thresholds.
Why This Matters
Individual positions may look fine, but aggregated exposure can be catastrophic. If you're long 500 delta across 5 tech call spreads, a sector selloff crushes all of them at once. Portfolio Greeks show this risk BEFORE it hits.
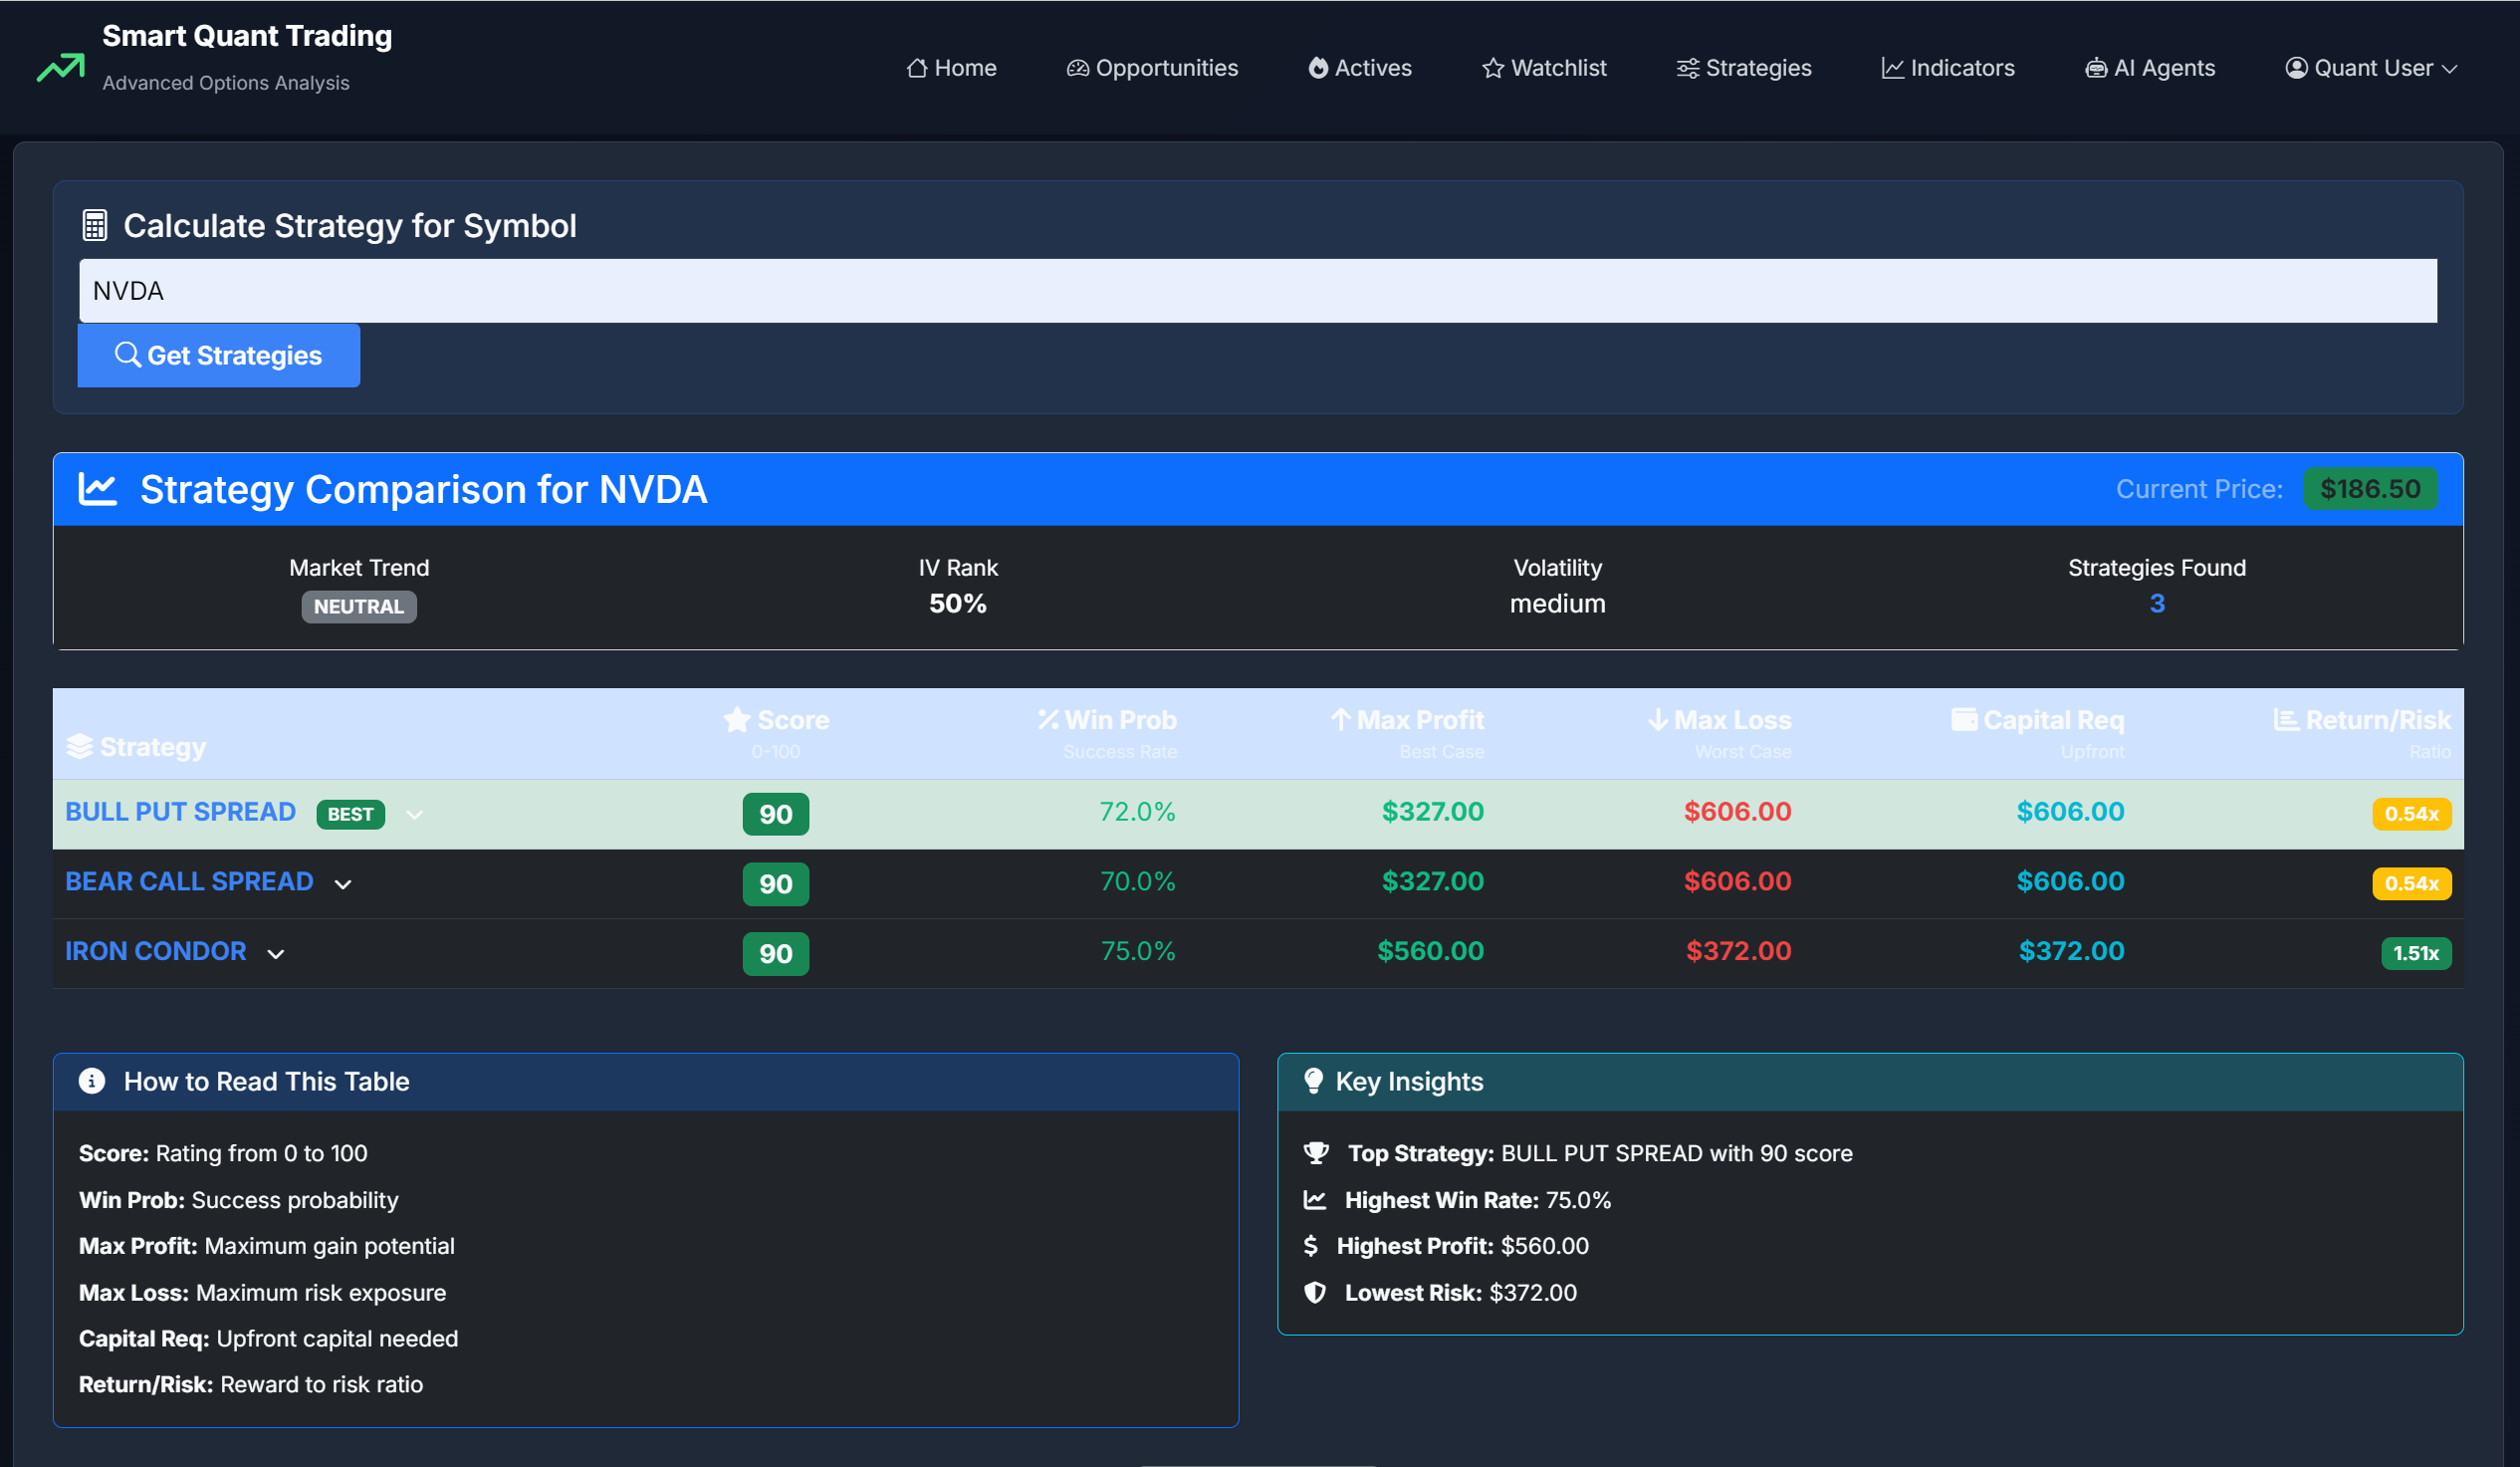
Evaluate: Compare Strategy Options
For any stock, see recommended strategies based on current volatility, upcoming earnings, and market conditions. Compare spreads, straddles, iron condors, and butterflies side-by-side with risk/reward profiles and P&L diagrams. Choose the strategy that matches your outlook and risk tolerance.
Why This Matters
Same stock, different strategies have wildly different risk profiles. An iron condor might risk $500 to make $200, while a call spread risks $1,000 to make $1,500. You need to compare options before committing.
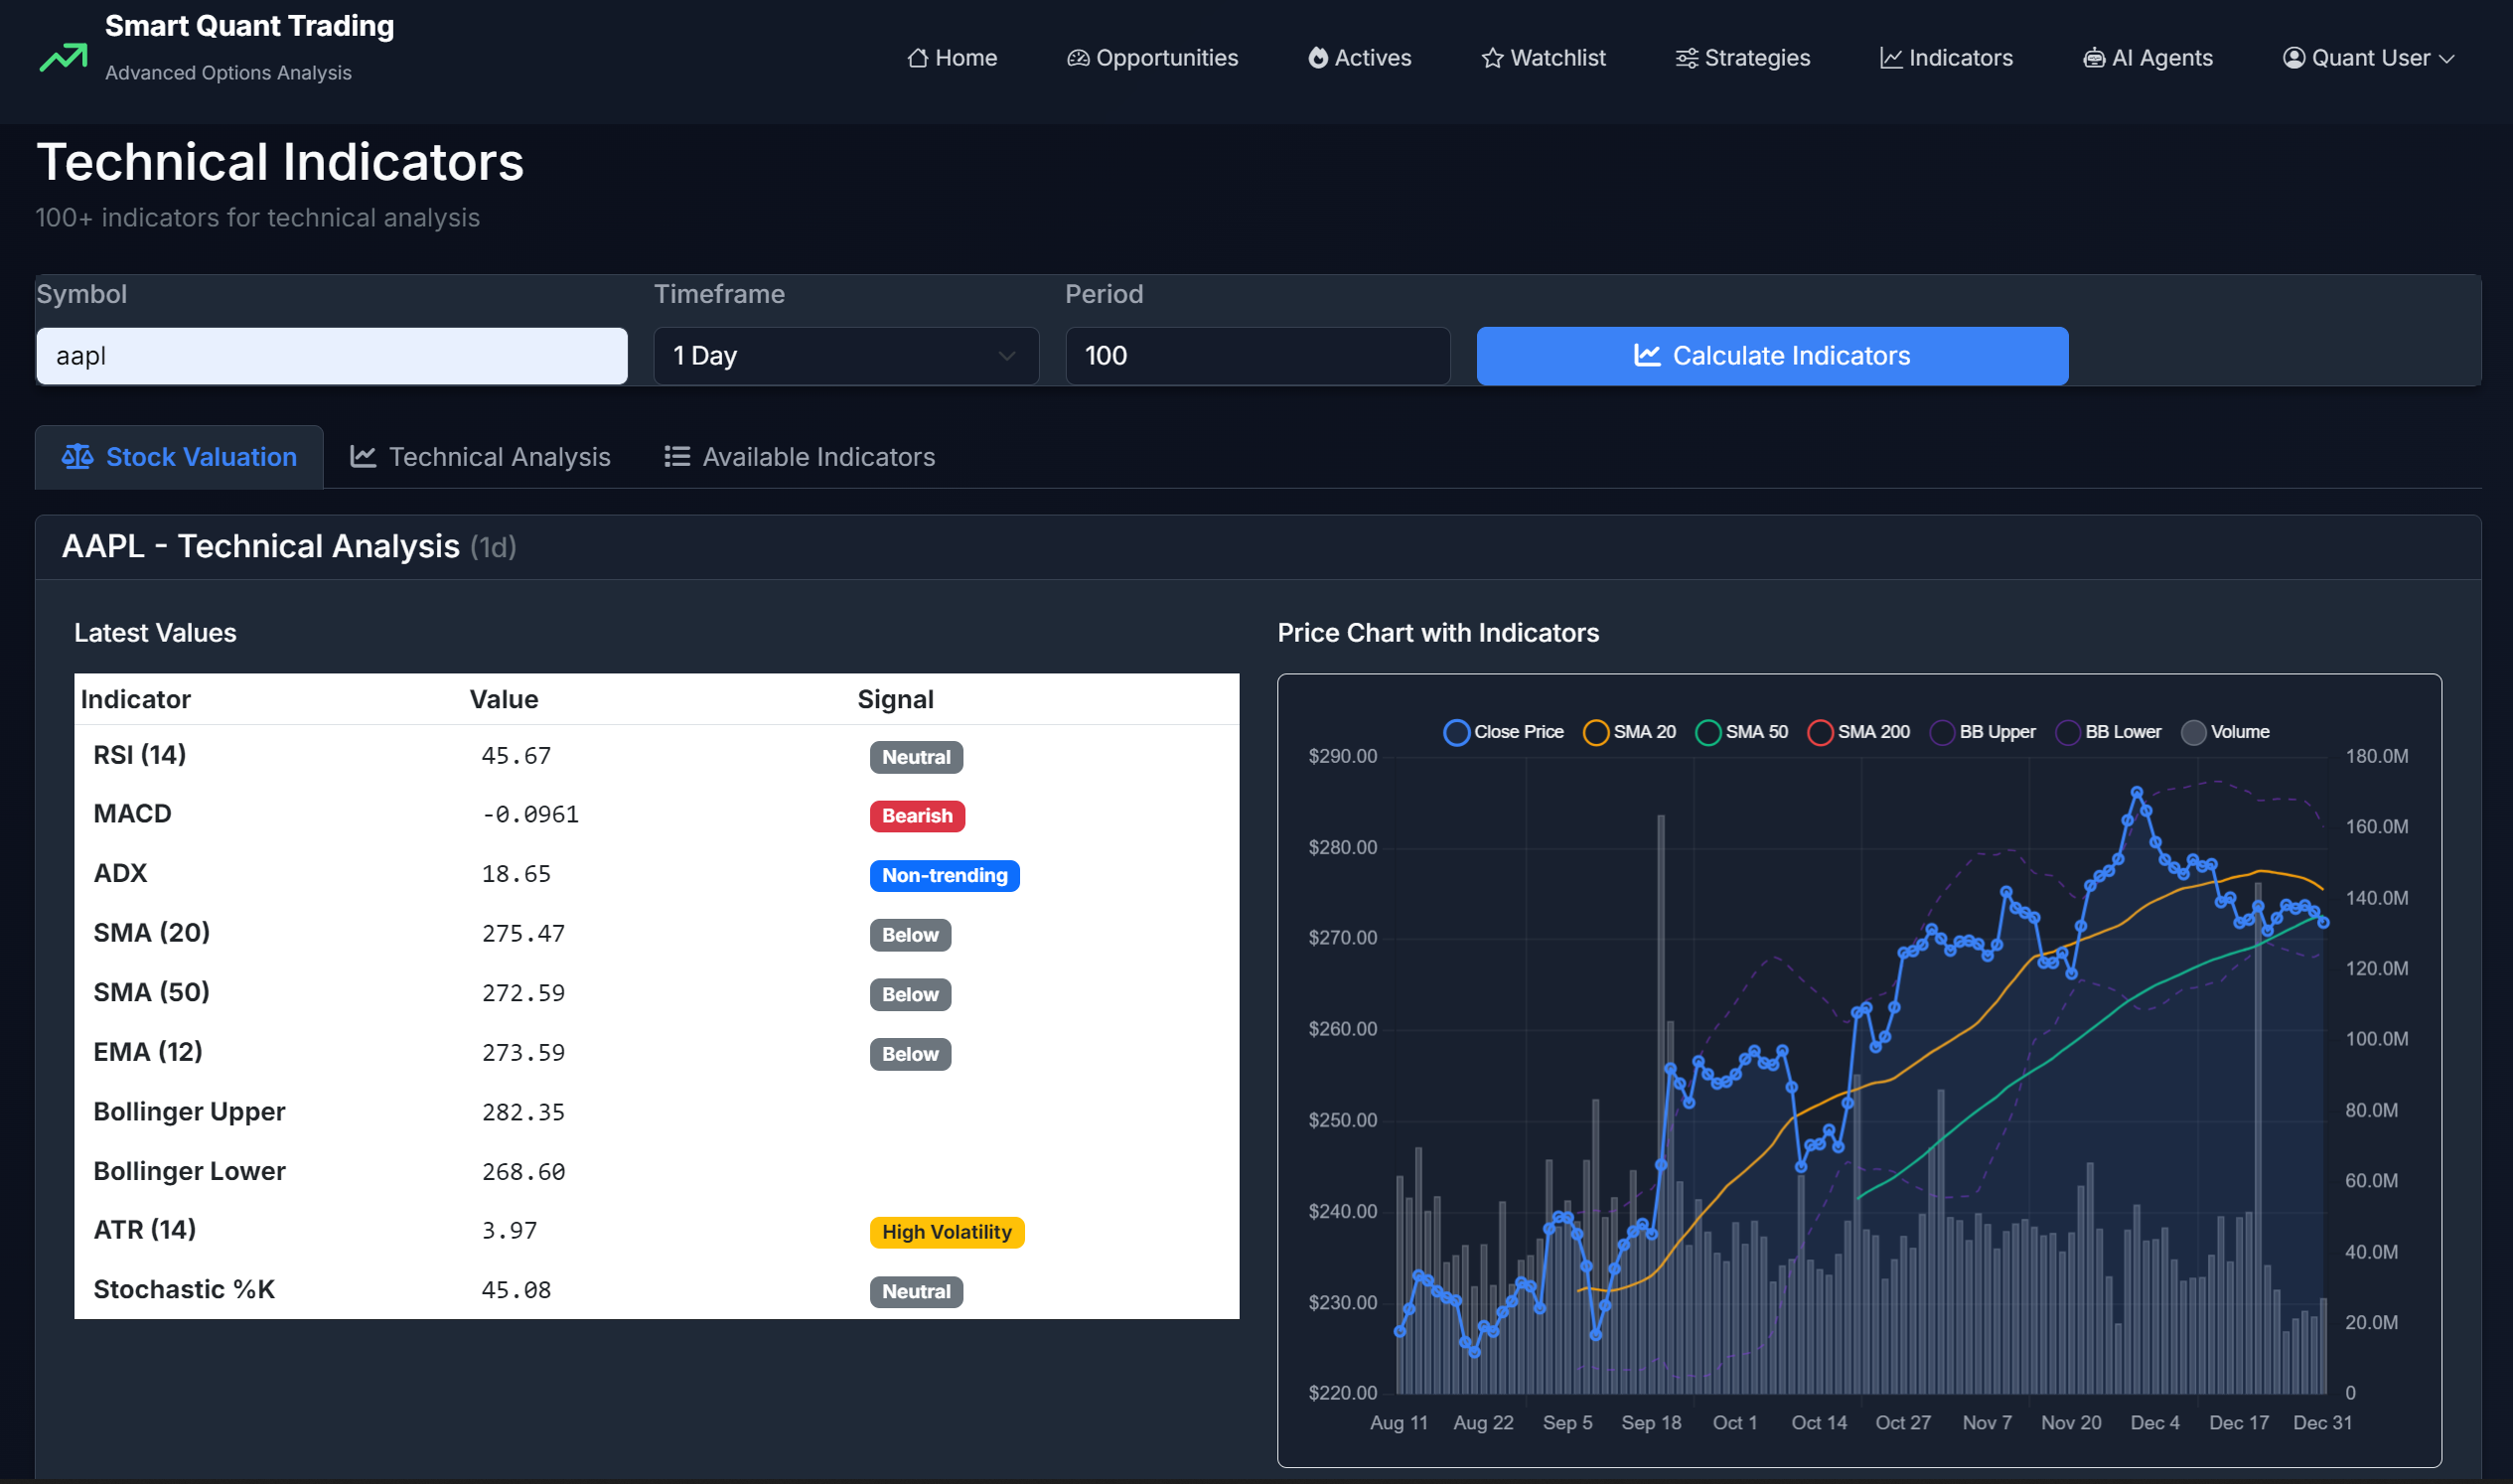
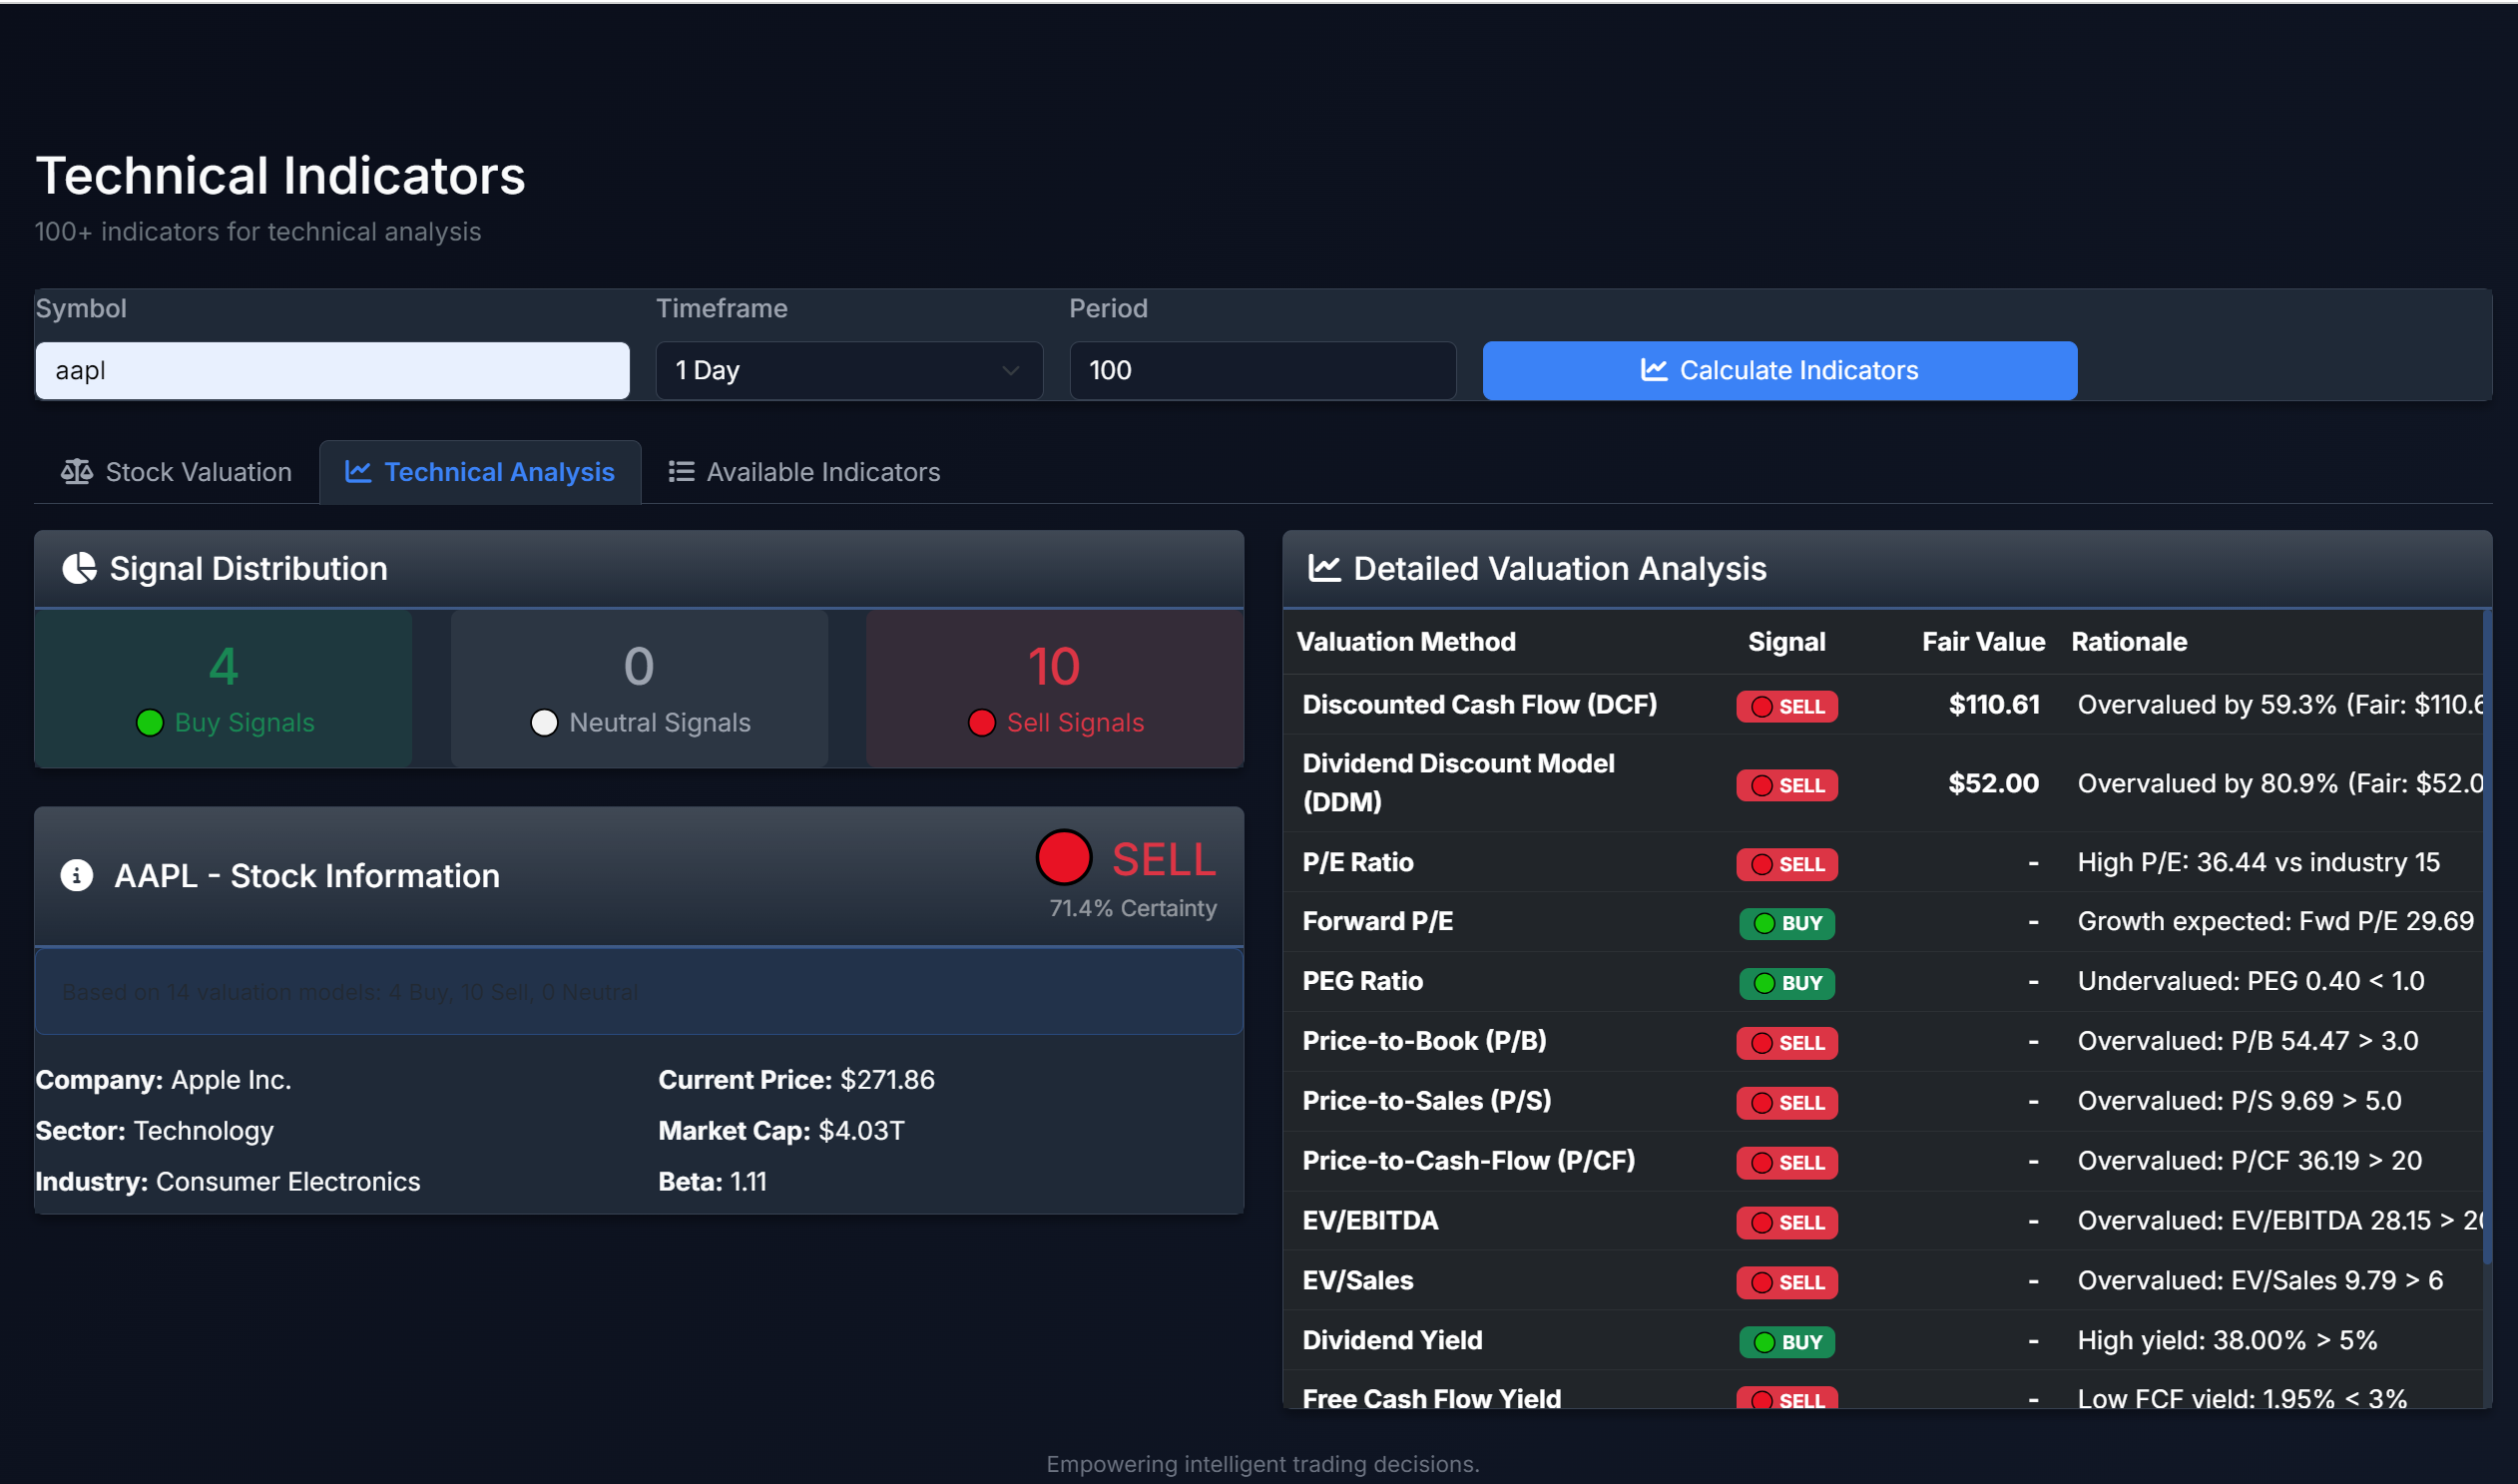
Understand: Analyze Stock Fundamentals
View comprehensive stock metrics including Greeks analysis, fundamental data (earnings, revenue, margins), technical indicators (moving averages, RSI, MACD), and historical volatility. See analyst ratings, price targets, and support/resistance levels. All data is presented with visual charts and clear explanations.
Why This Matters
You need context before trading options on a stock. Is it overextended? Near earnings? High IV rank? These factors determine whether your strategy has an edge or not.
Discover: Review Research Ideas
See opportunities identified through analysis of price patterns, volume trends, options flow, and market conditions. Each idea includes an explanation of why it might be worth investigating, relevant metrics, and potential strategies. These are research starting points — you evaluate each idea and decide whether it fits your strategy.
Why This Matters
You can't watch 500 stocks manually. Automated screening surfaces potential opportunities you might have missed, giving you more ideas to research and validate.
Automate: Configure Research Agents (Pro)
Set up automated research agents to continuously monitor markets based on your criteria (risk tolerance, preferred strategies, target stocks). Agents generate reports showing which opportunities they evaluated and why. They work in advisory mode only — providing research, not executing trades. You make all decisions and trade in your own brokerage account.
Why This Matters
You can't monitor markets 24/7. Agents scan continuously and alert you when opportunities matching your criteria appear, so you don't miss setups while you're working or sleeping.
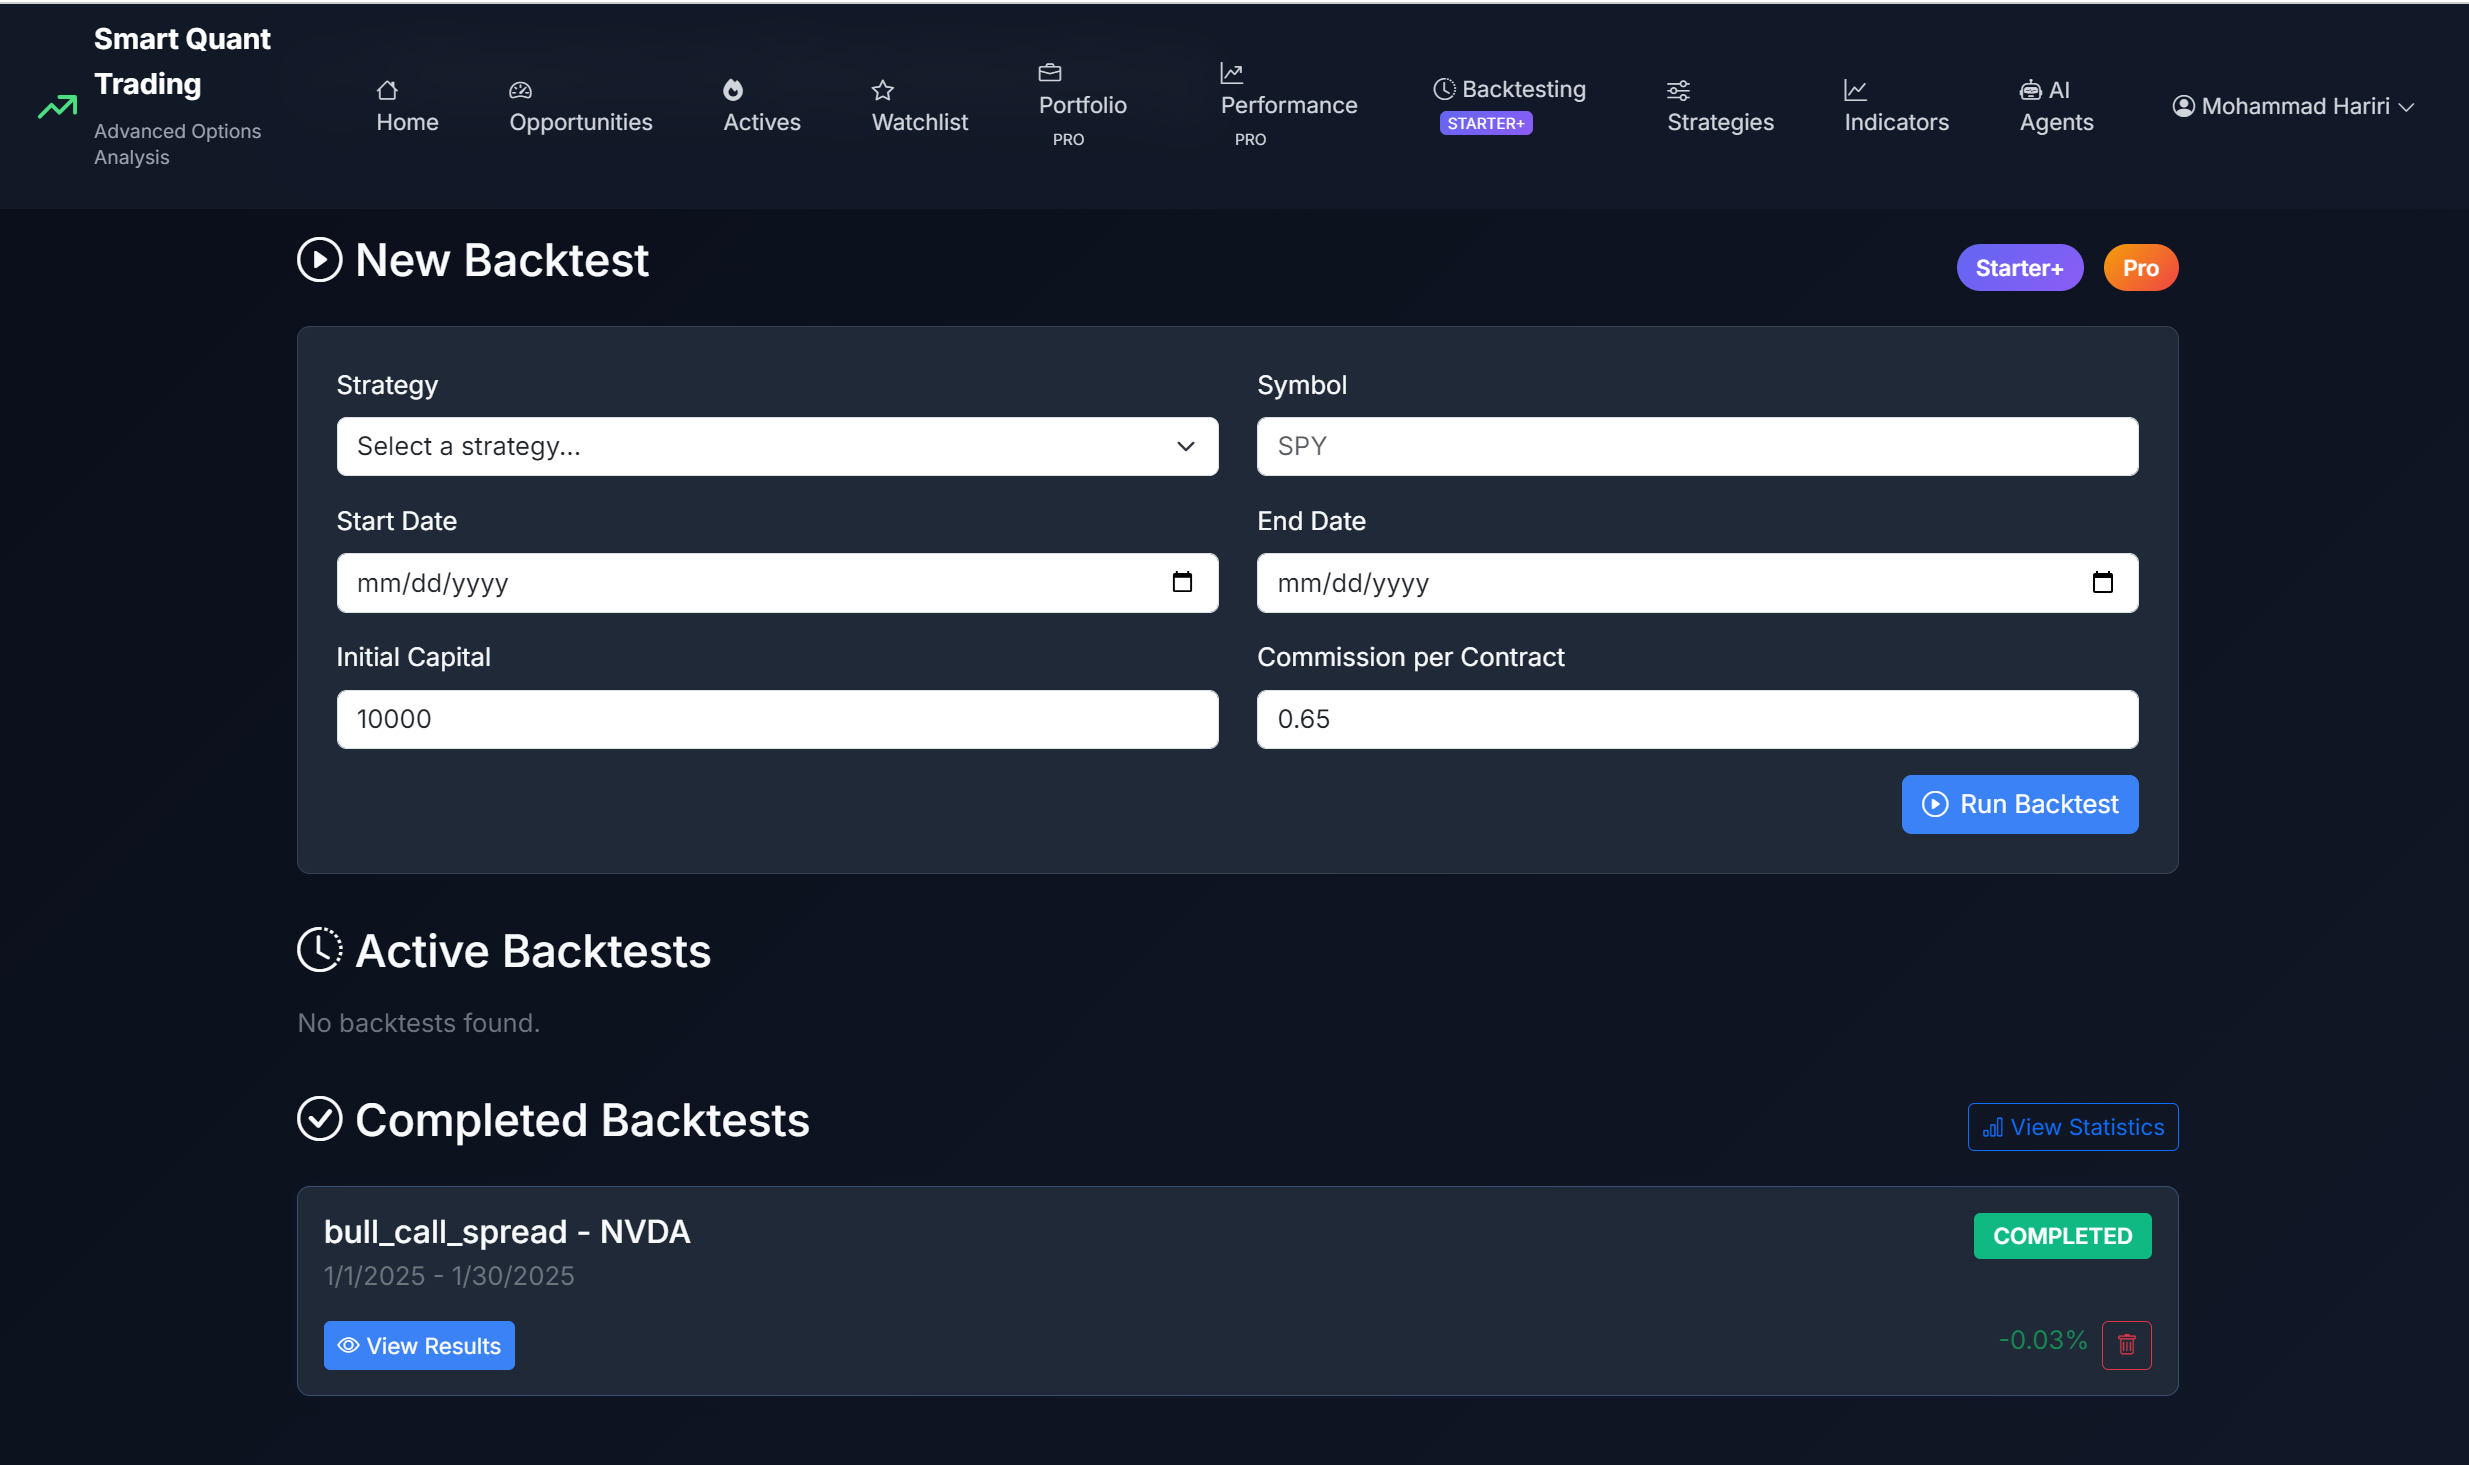
Validate: Test Strategies with Historical Data (Pro)
Simulate how a strategy would have performed using historical data. See total return, win rate, maximum drawdown, Sharpe ratio, and trade logs with entry/exit points. Configure custom rules for entry/exit, position sizing, DTE ranges, and risk management. CRITICAL: Past performance does NOT guarantee future results. Use backtesting to understand strategy mechanics and historical behavior — not to predict future outcomes.
Why This Matters
Better to discover a strategy fails in backtests than with real money. If your iron condor idea would have lost 40% in the 2020 crash, you want to know BEFORE trading it live. Backtesting shows historical weaknesses.
Ready to Start Researching?
See how SmartQuant can help you understand options, evaluate trades, and make more informed decisions
Start Free AccountResearch tool only. Not investment advice. You execute all trades in your own brokerage account.